
- Start >
- Rivers >
- Discharge >
- Bayern >
- Güntersthal >
- Chart of year

Chart of year Güntersthal / Pegnitz
Discharge from 28.01.2022 to 27.01.2023
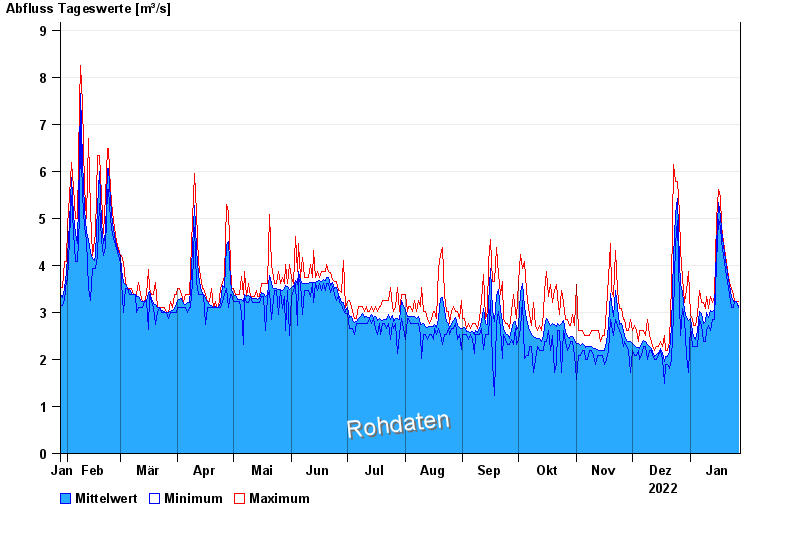
| Date | Mean value [m³/s] | Maximum [m³/s] | Minimum [m³/s] |
|---|---|---|---|
| 27.01.2023 | 3.13 | 3.24 | 3.11 |
| 26.01.2023 | 3.24 | 3.24 | 3.24 |
| 25.01.2023 | 3.24 | 3.24 | 3.24 |
| 24.01.2023 | 3.23 | 3.37 | 3.11 |
| 23.01.2023 | 3.33 | 3.5 | 3.11 |
| 22.01.2023 | 3.57 | 3.64 | 3.37 |
| 21.01.2023 | 3.84 | 3.92 | 3.64 |
© Bayerisches Landesamt für Umwelt 2024