
- Start >
- Rivers >
- Discharge >
- Bayern >
- Heroldingen >
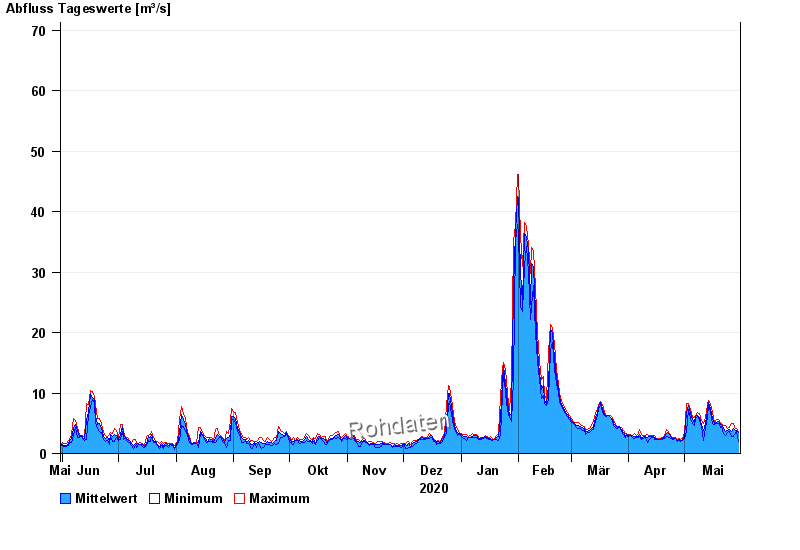
- Chart of year

Chart of year Heroldingen / Wörnitz
Discharge from 31.05.2020 to 30.05.2021
- 21.12.1993 Abfluss: 409 m³/s
- 14.04.1994 Abfluss: 401 m³/s
- 17.03.1988 Abfluss: 299 m³/s
- 31.01.1982 Abfluss: 279 m³/s
- 30.10.1998 Abfluss: 199 m³/s
| Date | Mean value [m³/s] | Maximum [m³/s] | Minimum [m³/s] |
|---|---|---|---|
| 30.05.2021 | 3.46 | 3.7 | 2.02 |
| 29.05.2021 | 3.83 | 4.21 | 3.7 |
| 28.05.2021 | 3.96 | 4.35 | 3.21 |
| 27.05.2021 | 4.1 | 5.03 | 2.86 |
| 26.05.2021 | 3.61 | 5.03 | 2.86 |
| 25.05.2021 | 3.91 | 4.35 | 3.57 |
| 24.05.2021 | 3.79 | 4.21 | 3.45 |
© Bayerisches Landesamt für Umwelt 2024