

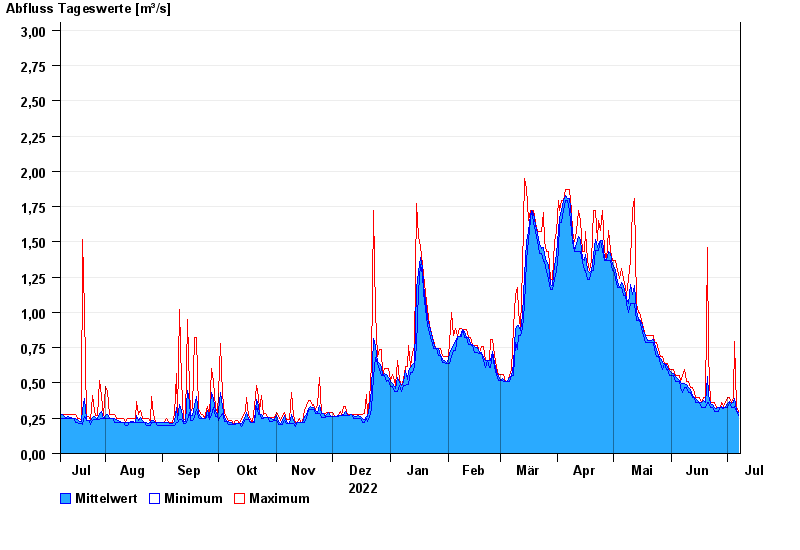
Chart of year Hobbach / Elsava
Discharge from 08.07.2022 to 07.07.2023
- 14.01.2011 Abfluss: 13,5 m³/s
- 27.01.1995 Abfluss: 11,1 m³/s
- 01.06.2013 Abfluss: 7,61 m³/s
- 04.03.2008 Abfluss: 7,51 m³/s
- 15.04.1994 Abfluss: 7,42 m³/s
| Date | Mean value [m³/s] | Maximum [m³/s] | Minimum [m³/s] |
|---|---|---|---|
| 07.07.2023 | 0.288 | 0.299 | 0.268 |
| 06.07.2023 | 0.307 | 0.331 | 0.298 |
| 05.07.2023 | 0.387 | 0.796 | 0.331 |
| 04.07.2023 | 0.358 | 0.398 | 0.329 |
| 03.07.2023 | 0.356 | 0.362 | 0.329 |
| 02.07.2023 | 0.371 | 0.397 | 0.362 |
| 01.07.2023 | 0.355 | 0.397 | 0.328 |
© Bayerisches Landesamt für Umwelt 2024