
- Start >
- Rivers >
- Discharge >
- Bayern >
- Hörmanshofen >
- Chart of year

Chart of year Hörmanshofen / Geltnach
Discharge from 01.01.2019 to 31.12.2019
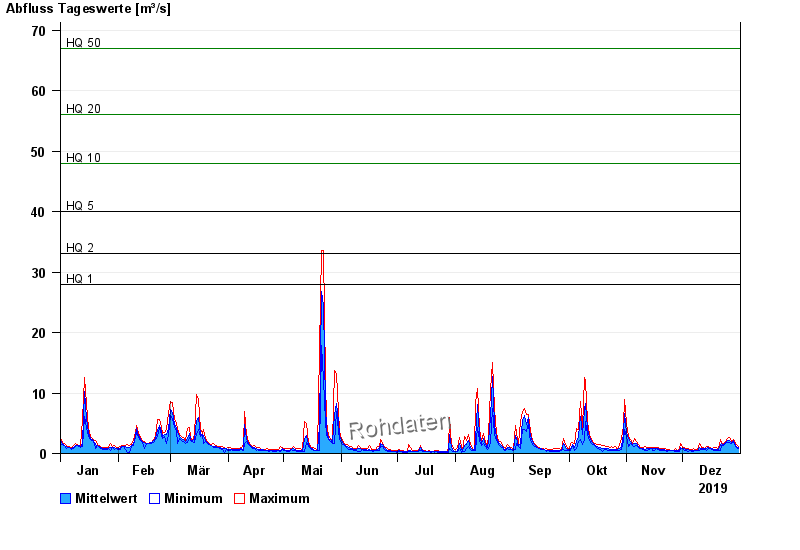
- HQ1 28 m³/s
- HQ2 33 m³/s
- HQ5 40 m³/s
- HQ10 48 m³/s
- HQ20 56 m³/s
- HQ50 67 m³/s
- HQ100 75 m³/s
| Date | Mean value [m³/s] | Maximum [m³/s] | Minimum [m³/s] |
|---|---|---|---|
| 31.12.2019 | 1.02 | 1.19 | 0.869 |
| 30.12.2019 | 1.24 | 1.45 | 0.968 |
| 29.12.2019 | 1.64 | 2 | 1.45 |
| 28.12.2019 | 2.17 | 2.3 | 1.85 |
| 27.12.2019 | 1.75 | 2 | 1.58 |
| 26.12.2019 | 2.22 | 2.63 | 1.85 |
| 25.12.2019 | 2.16 | 2.46 | 1.85 |
© Bayerisches Landesamt für Umwelt 2024