
- Start >
- Rivers >
- Discharge >
- Bayern >
- Iglersreuth Speicherzufluss >
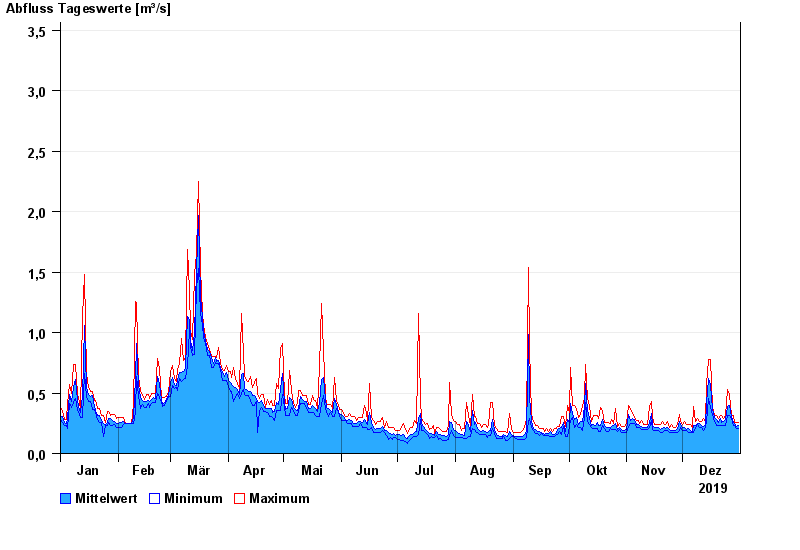
- Chart of year

Chart of year Iglersreuth Speicherzufluss / Tirschenreuther Waldnaab
Discharge from 01.01.2019 to 31.12.2019
- 10.08.1984 Abfluss: 80 m³/s
- 05.05.1984 Abfluss: 54,7 m³/s
- 14.06.2020 Abfluss: 16,5 m³/s
- 06.06.1984 Abfluss: 15,9 m³/s
- 12.02.2005 Abfluss: 14,1 m³/s
| Date | Mean value [m³/s] | Maximum [m³/s] | Minimum [m³/s] |
|---|---|---|---|
| 31.12.2019 | 0.233 | 0.258 | 0.208 |
| 30.12.2019 | 0.226 | 0.258 | 0.208 |
| 29.12.2019 | 0.247 | 0.258 | 0.232 |
| 28.12.2019 | 0.258 | 0.316 | 0.233 |
| 27.12.2019 | 0.303 | 0.316 | 0.287 |
| 26.12.2019 | 0.398 | 0.487 | 0.316 |
| 25.12.2019 | 0.386 | 0.526 | 0.317 |
© Bayerisches Landesamt für Umwelt 2024