
- Start >
- Rivers >
- Discharge >
- Bayern >
- Iglersreuth Speicherzufluss >
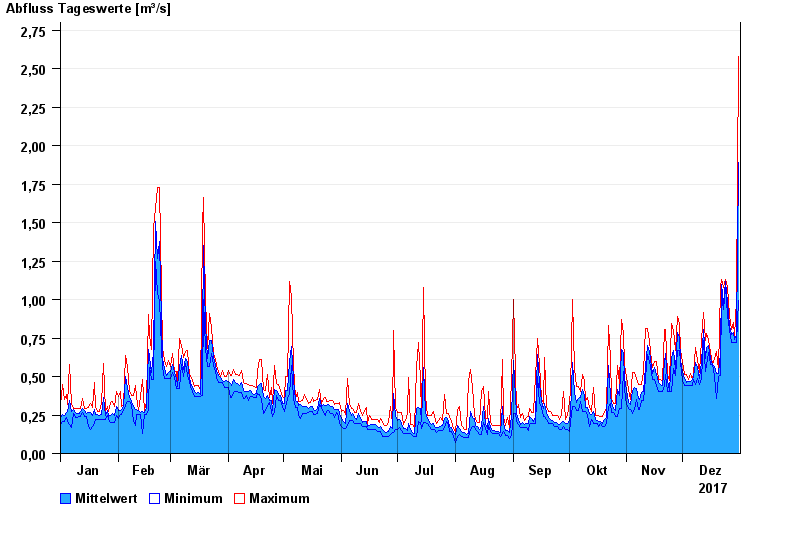
- Chart of year

Chart of year Iglersreuth Speicherzufluss / Tirschenreuther Waldnaab
Discharge from 01.01.2017 to 31.12.2017
| Date | Mean value [m³/s] | Maximum [m³/s] | Minimum [m³/s] |
|---|---|---|---|
| 31.12.2017 | 1.89 | 2.58 | 0.997 |
| 30.12.2017 | 0.768 | 0.997 | 0.723 |
| 29.12.2017 | 0.738 | 0.766 | 0.722 |
| 28.12.2017 | 0.783 | 0.854 | 0.72 |
| 27.12.2017 | 0.77 | 0.806 | 0.72 |
| 26.12.2017 | 0.832 | 0.894 | 0.804 |
| 25.12.2017 | 0.979 | 1.08 | 0.894 |
© Bayerisches Landesamt für Umwelt 2024