

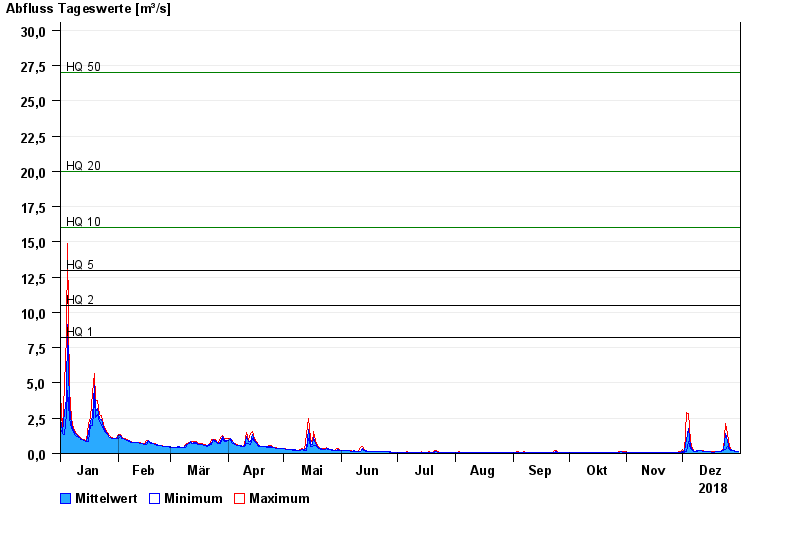
Chart of year Illesheim / Aisch
Discharge from 01.01.2018 to 31.12.2018
note
Wasserstand und Abfluss wird zeitweise durch Biberdamm beeinflusst.
- HQ1 8,2 m³/s
- HQ2 10,5 m³/s
- HQ5 13 m³/s
- HQ10 16 m³/s
- HQ20 20 m³/s
- HQ50 27 m³/s
- HQ100 32 m³/s
| Date | Mean value [m³/s] | Maximum [m³/s] | Minimum [m³/s] |
|---|---|---|---|
| 31.12.2018 | 0.166 | 0.171 | 0.165 |
| 30.12.2018 | 0.171 | 0.177 | 0.171 |
| 29.12.2018 | 0.184 | 0.198 | 0.177 |
| 28.12.2018 | 0.216 | 0.235 | 0.198 |
| 27.12.2018 | 0.257 | 0.286 | 0.235 |
| 26.12.2018 | 0.37 | 0.488 | 0.286 |
| 25.12.2018 | 0.826 | 1.44 | 0.488 |
© Bayerisches Landesamt für Umwelt 2024