

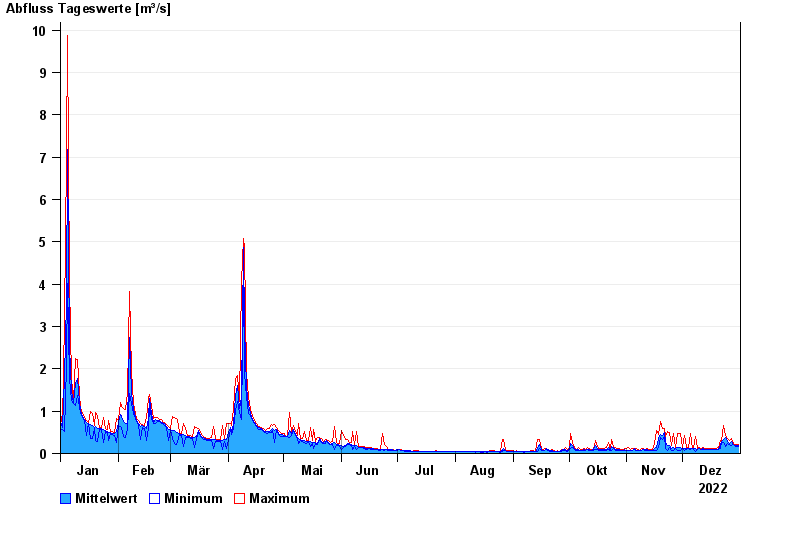
Chart of year Illesheim / Aisch
Discharge from 01.01.2022 to 31.12.2022
note
Wasserstand und Abfluss wird zeitweise durch Biberdamm beeinflusst.
| Date | Mean value [m³/s] | Maximum [m³/s] | Minimum [m³/s] |
|---|---|---|---|
| 31.12.2022 | 0.188 | 0.219 | 0.174 |
| 30.12.2022 | 0.189 | 0.202 | 0.173 |
| 29.12.2022 | 0.197 | 0.216 | 0.179 |
| 28.12.2022 | 0.224 | 0.247 | 0.208 |
| 27.12.2022 | 0.282 | 0.365 | 0.199 |
| 26.12.2022 | 0.231 | 0.297 | 0.205 |
| 25.12.2022 | 0.274 | 0.36 | 0.243 |
© Bayerisches Landesamt für Umwelt 2024