

Chart of year Kösfeld / Sulzbach
Discharge from 18.01.2021 to 17.01.2022
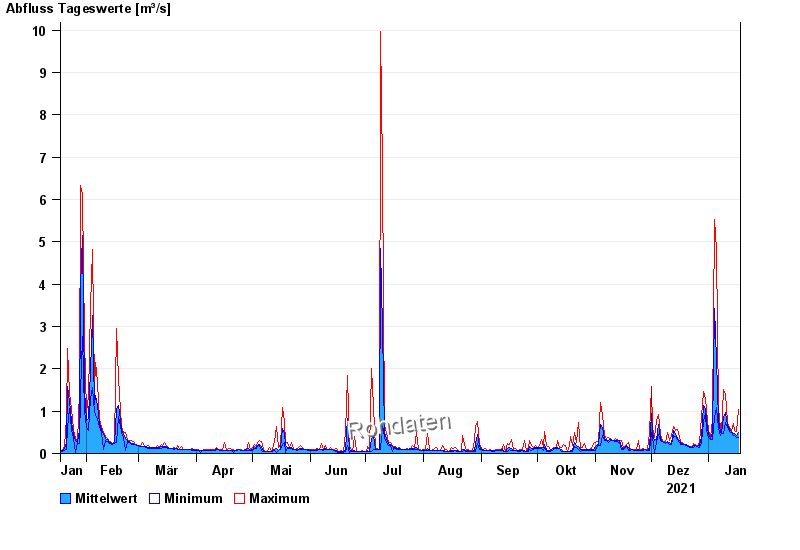
| Date | Mean value [m³/s] | Maximum [m³/s] | Minimum [m³/s] |
|---|---|---|---|
| 17.01.2022 | 0.494 | 1.03 | 0.386 |
| 16.01.2022 | 0.429 | 0.528 | 0.386 |
| 15.01.2022 | 0.463 | 0.55 | 0.425 |
| 14.01.2022 | 0.483 | 0.715 | 0.425 |
| 13.01.2022 | 0.523 | 0.55 | 0.506 |
| 12.01.2022 | 0.564 | 0.618 | 0.528 |
| 11.01.2022 | 0.658 | 0.74 | 0.618 |
© Bayerisches Landesamt für Umwelt 2024