

Chart of year Landsberg / Lech
Discharge from 01.01.2018 to 31.12.2018
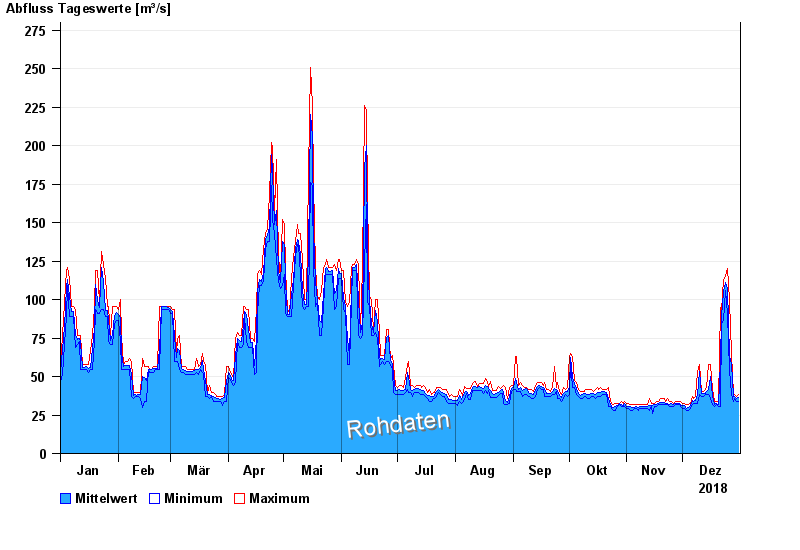
note
Messwerte beeinflusst durch Kraftwerkssteuerung.
| Date | Mean value [m³/s] | Maximum [m³/s] | Minimum [m³/s] |
|---|---|---|---|
| 31.12.2018 | 36.4 | 38.5 | 34 |
| 30.12.2018 | 35.8 | 37 | 34 |
| 29.12.2018 | 37 | 38.5 | 35.5 |
| 28.12.2018 | 37 | 38.5 | 34 |
| 27.12.2018 | 57.7 | 65.1 | 38.5 |
| 26.12.2018 | 63.9 | 99.5 | 54.5 |
| 25.12.2018 | 107 | 120 | 90.5 |
© Bayerisches Landesamt für Umwelt 2025