
- Start >
- Rivers >
- Discharge >
- Bayern >
- Langengeisling >
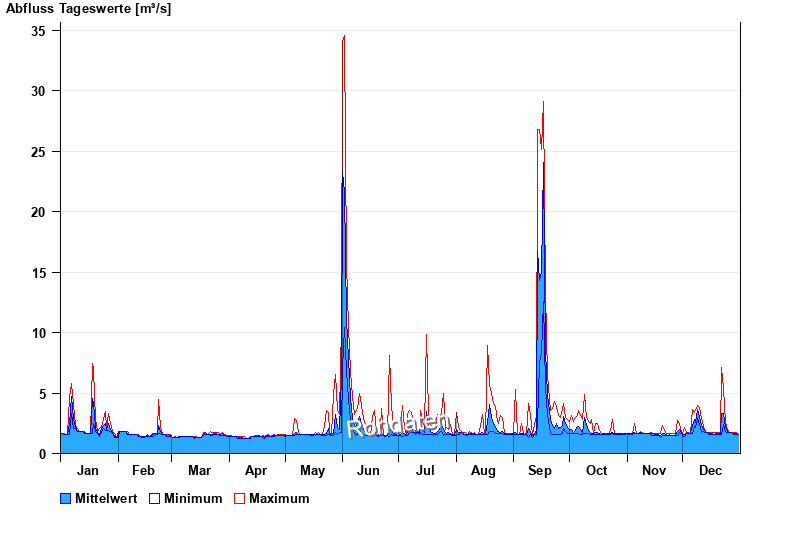
- Chart of year

Chart of year Langengeisling / Saubach
Discharge from 01.01.2024 to 31.12.2024
| Date | Mean value [m³/s] | Maximum [m³/s] | Minimum [m³/s] |
|---|---|---|---|
| 18.12.2024 | 1.6 | 1.6 | 1.6 |
| 17.12.2024 | 1.62 | 1.72 | 1.6 |
| 16.12.2024 | 1.66 | 1.72 | 1.6 |
| 15.12.2024 | 1.71 | 1.72 | 1.6 |
| 14.12.2024 | 1.72 | 1.72 | 1.72 |
| 13.12.2024 | 1.78 | 1.85 | 1.72 |
| 12.12.2024 | 1.95 | 2.25 | 1.85 |
© Bayerisches Landesamt für Umwelt 2024