
- Start >
- Rivers >
- Discharge >
- Bayern >
- Laufermühle >
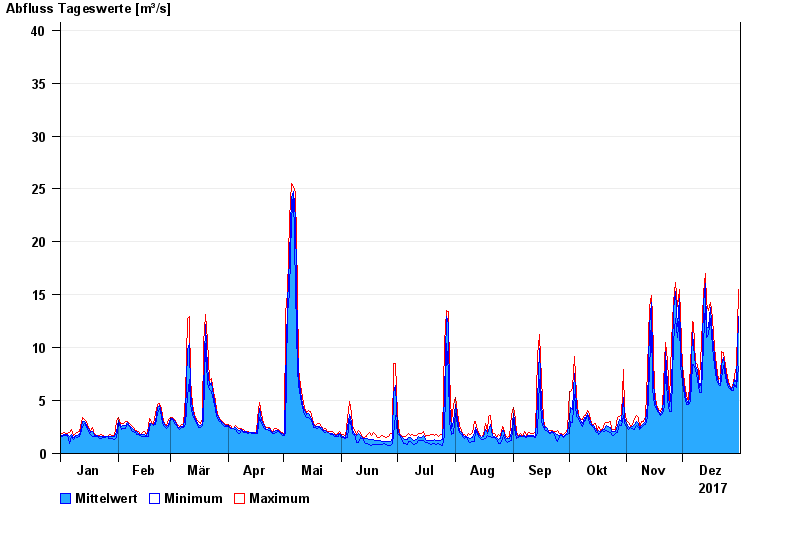
- Chart of year

Chart of year Laufermühle / Aisch
Discharge from 01.01.2017 to 31.12.2017
- 29.07.1941 Abfluss: 360 m³/s
- 10.07.2021 Abfluss: 218 m³/s
- 19.03.1942 Abfluss: 188 m³/s
- 26.01.1995 Abfluss: 186 m³/s
- 01.06.2013 Abfluss: 184 m³/s
| Date | Mean value [m³/s] | Maximum [m³/s] | Minimum [m³/s] |
|---|---|---|---|
| 31.12.2017 | 12.9 | 15.5 | 8.24 |
| 30.12.2017 | 6.75 | 8.24 | 6.21 |
| 29.12.2017 | 7 | 7.41 | 6.48 |
| 28.12.2017 | 6.44 | 6.68 | 5.97 |
| 27.12.2017 | 6.04 | 6.16 | 5.96 |
| 26.12.2017 | 6.29 | 6.42 | 6.16 |
| 25.12.2017 | 6.84 | 7.26 | 6.42 |
© Bayerisches Landesamt für Umwelt 2024