

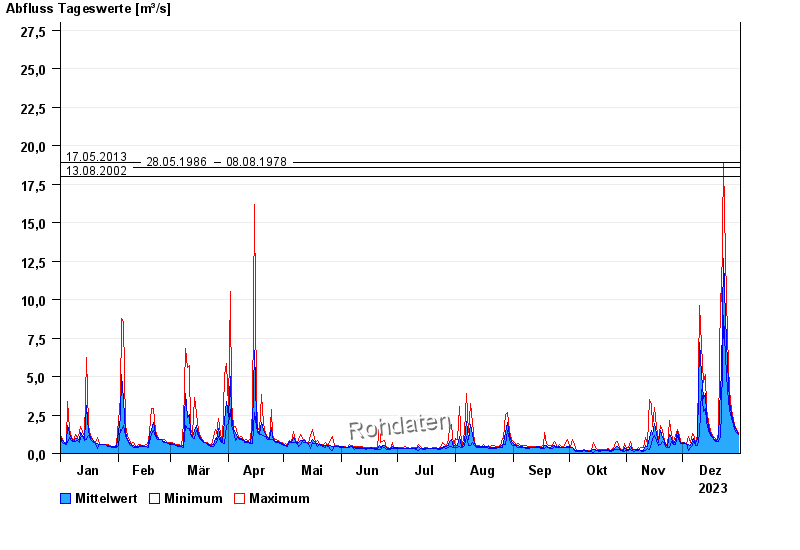
Chart of year Leming / Freybach
Discharge from 01.01.2023 to 31.12.2023
- 01.08.1991 Abfluss: 65,5 m³/s
- 25.06.2016 Abfluss: 56,1 m³/s
- 02.06.2024 Abfluss: 46,9 m³/s
- 17.05.2013 Abfluss: 44,4 m³/s
- 28.05.1986 Abfluss: 42,3 m³/s
| Date | Mean value [m³/s] | Maximum [m³/s] | Minimum [m³/s] |
|---|---|---|---|
| 31.12.2023 | 1.29 | 1.36 | 1.22 |
| 30.12.2023 | 1.45 | 1.59 | 1.35 |
| 29.12.2023 | 1.72 | 1.89 | 1.59 |
| 28.12.2023 | 1.98 | 2.2 | 1.89 |
| 27.12.2023 | 2.48 | 2.75 | 2.2 |
| 26.12.2023 | 3.29 | 4.08 | 2.75 |
| 25.12.2023 | 5.72 | 7.39 | 4.08 |
© Bayerisches Landesamt für Umwelt 2025