
- Start >
- Rivers >
- Discharge >
- Bayern >
- Manching (Ort) >
- Chart of year

Chart of year Manching (Ort) / Paar
Discharge from 01.01.2023 to 31.12.2023
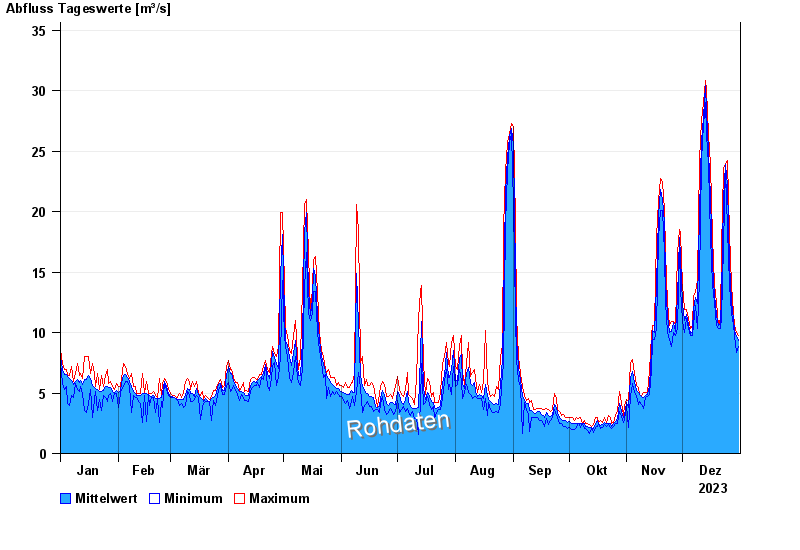
| Date | Mean value [m³/s] | Maximum [m³/s] | Minimum [m³/s] |
|---|---|---|---|
| 31.12.2023 | 8.34 | 8.64 | 8.04 |
| 30.12.2023 | 8.61 | 8.84 | 7.66 |
| 29.12.2023 | 8.98 | 9.26 | 8.64 |
| 28.12.2023 | 9.6 | 9.89 | 9.26 |
| 27.12.2023 | 10.6 | 11.4 | 9.89 |
| 26.12.2023 | 12.6 | 14.4 | 11.4 |
| 25.12.2023 | 17.3 | 18.9 | 14.4 |
© Bayerisches Landesamt für Umwelt 2025