
- Start >
- Rivers >
- Discharge >
- Bayern >
- Manching (Ort) >
- Chart of year

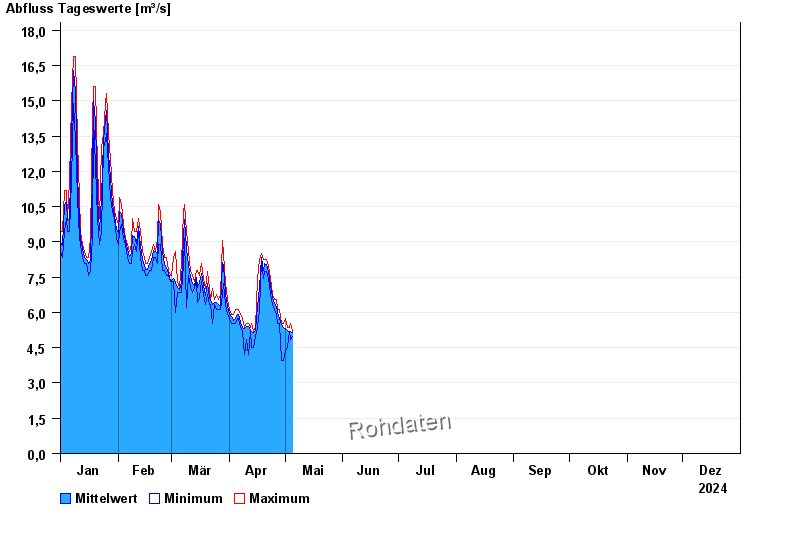
Chart of year Manching (Ort) / Paar
Discharge from 01.01.2024 to 31.12.2024
| Date | Mean value [m³/s] | Maximum [m³/s] | Minimum [m³/s] |
|---|---|---|---|
| 31.12.2024 | 7.26 | 7.4 | 7.21 |
| 30.12.2024 | 7.39 | 7.58 | 7.21 |
| 29.12.2024 | 7.6 | 7.76 | 7.58 |
| 28.12.2024 | 7.81 | 7.98 | 7.76 |
| 27.12.2024 | 7.98 | 8.17 | 7.76 |
| 26.12.2024 | 8.34 | 8.59 | 7.98 |
| 25.12.2024 | 9.08 | 9.69 | 8.39 |
© Bayerisches Landesamt für Umwelt 2025