
- Start >
- Rivers >
- Discharge >
- Bayern >
- Michelfeld >
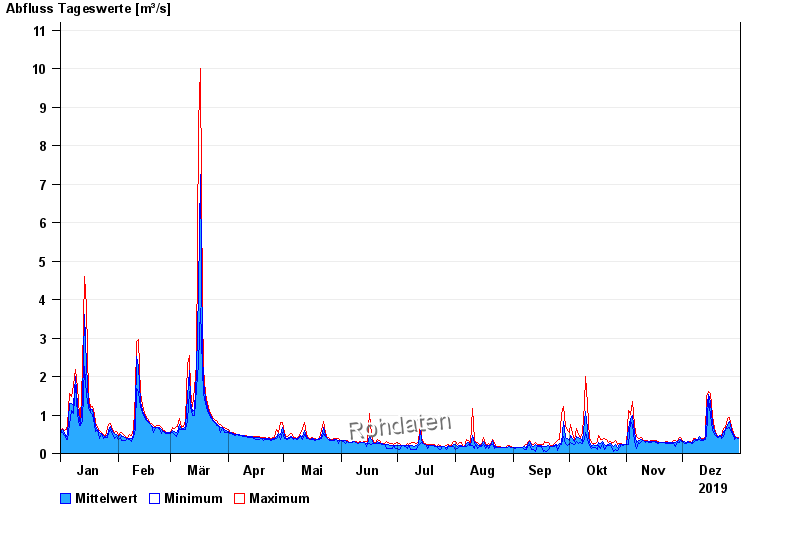
- Chart of year

Chart of year Michelfeld / Pegnitz
Discharge from 01.01.2019 to 31.12.2019
| Date | Mean value [m³/s] | Maximum [m³/s] | Minimum [m³/s] |
|---|---|---|---|
| 31.12.2019 | 0.402 | 0.422 | 0.394 |
| 30.12.2019 | 0.422 | 0.422 | 0.422 |
| 29.12.2019 | 0.446 | 0.477 | 0.366 |
| 28.12.2019 | 0.505 | 0.558 | 0.477 |
| 27.12.2019 | 0.622 | 0.691 | 0.558 |
| 26.12.2019 | 0.834 | 0.927 | 0.665 |
| 25.12.2019 | 0.762 | 0.9 | 0.639 |
© Bayerisches Landesamt für Umwelt 2025