
- Start >
- Rivers >
- Discharge >
- Bayern >
- Michelfeld >
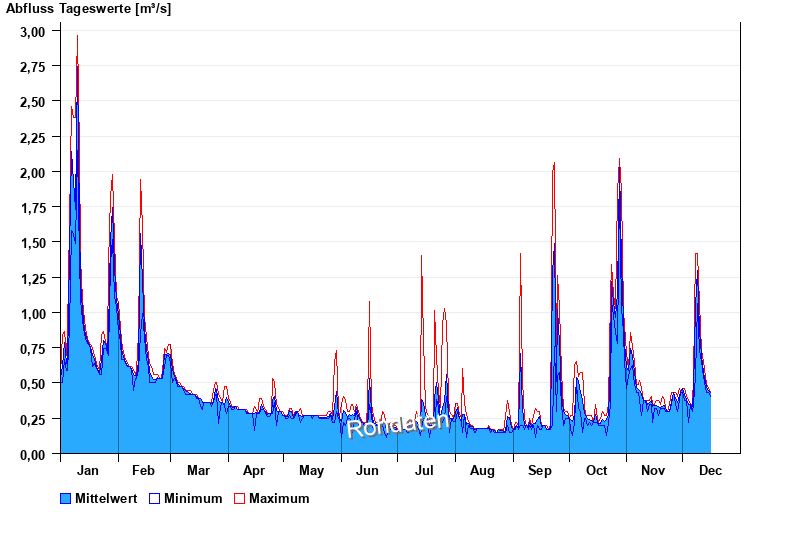
- Chart of year

Chart of year Michelfeld / Pegnitz
Discharge from 01.01.2025 to 31.12.2025
| Date | Mean value [m³/s] | Maximum [m³/s] | Minimum [m³/s] |
|---|---|---|---|
| 16.02.2025 | 0.791 | 0.819 | 0.718 |
| 15.02.2025 | 0.876 | 0.966 | 0.819 |
| 14.02.2025 | 1.22 | 1.61 | 0.993 |
| 13.02.2025 | 1.56 | 1.94 | 0.842 |
| 12.02.2025 | 0.65 | 0.842 | 0.587 |
| 11.02.2025 | 0.554 | 0.587 | 0.533 |
| 10.02.2025 | 0.554 | 0.561 | 0.533 |
© Bayerisches Landesamt für Umwelt 2025