
- Start >
- Rivers >
- Discharge >
- Bayern >
- Mittenwald >
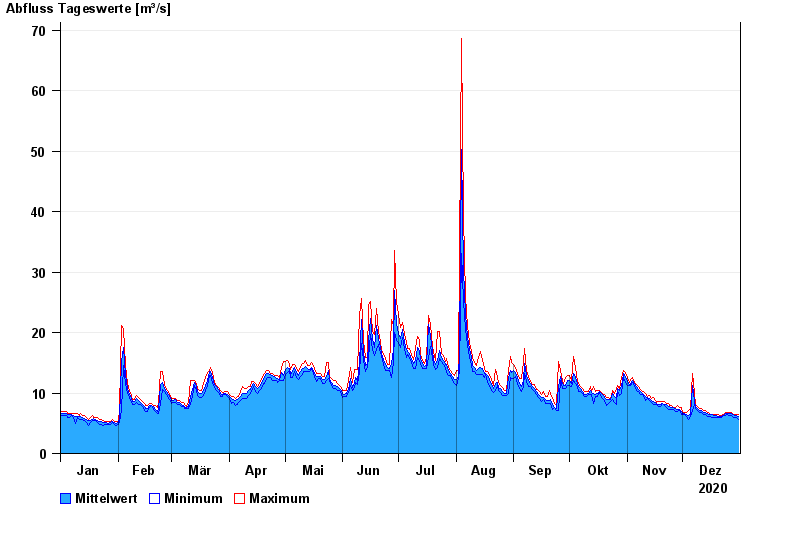
- Chart of year

Chart of year Mittenwald / Isar
Discharge from 01.01.2020 to 31.12.2020
| Date | Mean value [m³/s] | Maximum [m³/s] | Minimum [m³/s] |
|---|---|---|---|
| 31.12.2020 | 6.17 | 6.52 | 5.66 |
| 30.12.2020 | 6.24 | 6.52 | 5.93 |
| 29.12.2020 | 6.3 | 6.52 | 5.93 |
| 28.12.2020 | 6.39 | 6.52 | 5.93 |
| 27.12.2020 | 6.58 | 6.82 | 6.22 |
| 26.12.2020 | 6.57 | 6.82 | 6.22 |
| 25.12.2020 | 6.62 | 6.82 | 6.52 |
© Bayerisches Landesamt für Umwelt 2025