

Chart of year Moosburg / Isar
Discharge from 01.01.2024 to 31.12.2024
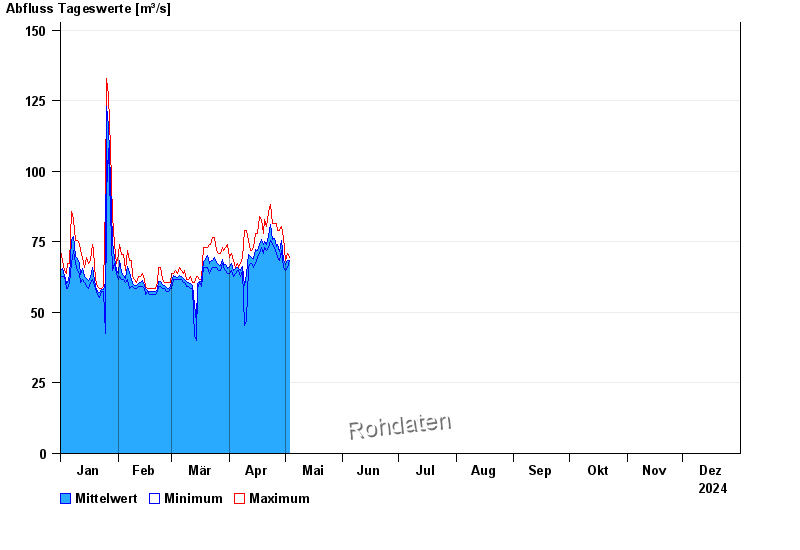
| Date | Mean value [m³/s] | Maximum [m³/s] | Minimum [m³/s] |
|---|---|---|---|
| 31.12.2024 | 62.9 | 78.7 | 58 |
| 30.12.2024 | 58.9 | 62.3 | 58 |
| 29.12.2024 | 60.1 | 63.4 | 58 |
| 28.12.2024 | 60.7 | 67.9 | 58 |
| 27.12.2024 | 58.3 | 66.8 | 55.9 |
| 26.12.2024 | 58.1 | 65.7 | 55.9 |
| 25.12.2024 | 61.7 | 75 | 57 |
© Bayerisches Landesamt für Umwelt 2025