
- Start >
- Rivers >
- Discharge >
- Bayern >
- Nattenhausen >
- Chart of year

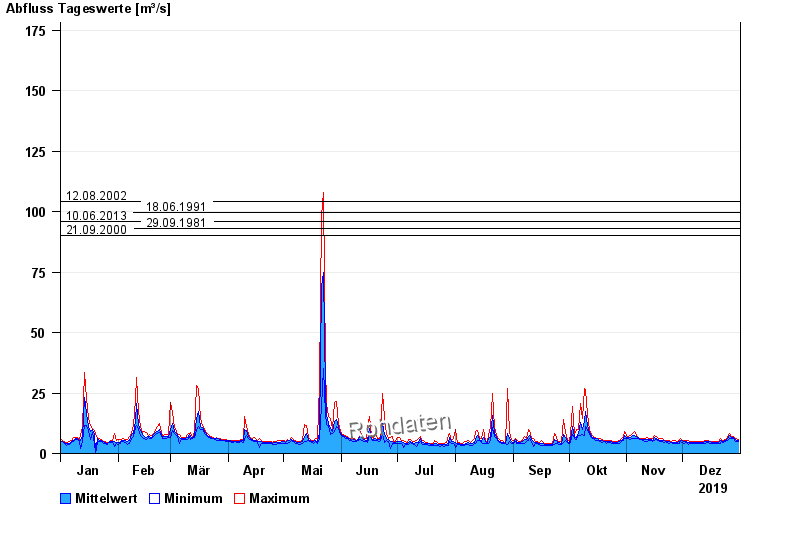
Chart of year Nattenhausen / Günz
Discharge from 01.01.2019 to 31.12.2019
- 02.06.2024 Abfluss: 221 m³/s
- 12.08.2002 Abfluss: 104 m³/s
- 18.06.1991 Abfluss: 99,6 m³/s
- 10.06.2013 Abfluss: 96 m³/s
- 22.05.2019 Abfluss: 93,5 m³/s
| Date | Mean value [m³/s] | Maximum [m³/s] | Minimum [m³/s] |
|---|---|---|---|
| 31.12.2019 | 5.15 | 5.86 | 4.69 |
| 30.12.2019 | 5.45 | 5.92 | 4.8 |
| 29.12.2019 | 5.99 | 6.39 | 5.44 |
| 28.12.2019 | 6.5 | 6.98 | 6.15 |
| 27.12.2019 | 6.49 | 6.88 | 6.24 |
| 26.12.2019 | 7.16 | 8.16 | 6.31 |
| 25.12.2019 | 5.94 | 6.78 | 5.14 |
© Bayerisches Landesamt für Umwelt 2025