

Chart of year Neuburg / Donau
Discharge from 01.01.2020 to 31.12.2020
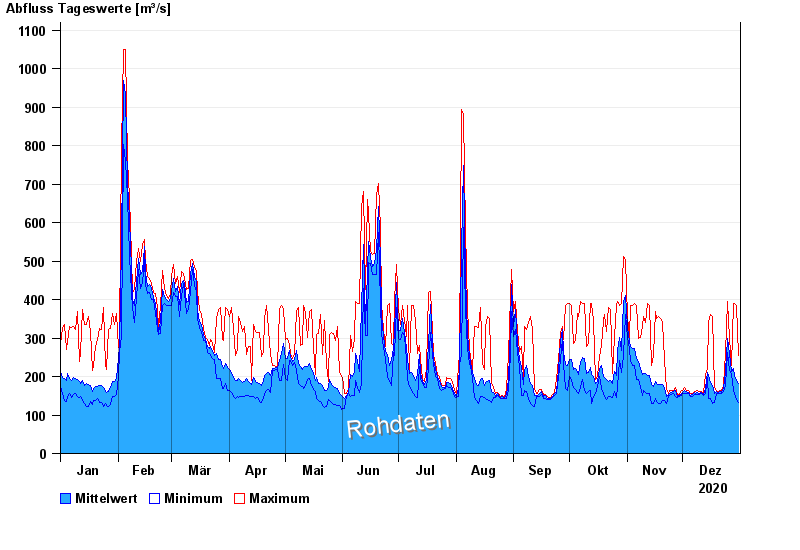
note
Messwerte derzeit durch Verlandung beeinflusst.
Hinweis zum Abfluss:
Provisorische Abflussermittlung für Zwecke des HND
| Date | Mean value [m³/s] | Maximum [m³/s] | Minimum [m³/s] |
|---|---|---|---|
| 31.12.2020 | 182 | 254 | 133 |
| 30.12.2020 | 189 | 385 | 141 |
| 29.12.2020 | 203 | 390 | 157 |
| 28.12.2020 | 220 | 390 | 163 |
| 27.12.2020 | 212 | 228 | 204 |
| 26.12.2020 | 259 | 298 | 216 |
| 25.12.2020 | 298 | 395 | 263 |
© Bayerisches Landesamt für Umwelt 2025