
- Start >
- Rivers >
- Discharge >
- Bayern >
- Neukenroth >
- Chart of year

Chart of year Neukenroth / Haßlach
Discharge from 01.01.2024 to 31.12.2024
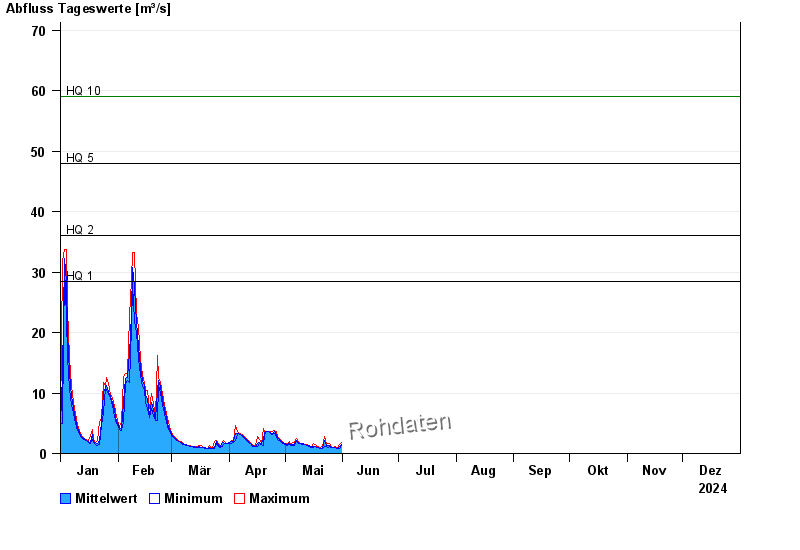
- HQ1 28,5 m³/s
- HQ2 36 m³/s
- HQ5 48 m³/s
- HQ10 59 m³/s
- HQ20 72 m³/s
- HQ50 90 m³/s
- HQ100 106 m³/s
| Date | Mean value [m³/s] | Maximum [m³/s] | Minimum [m³/s] |
|---|---|---|---|
| 22.11.2024 | 6.14 | 6.36 | 5.82 |
| 21.11.2024 | 6.84 | 7.21 | 6.36 |
| 20.11.2024 | 7.34 | 9.74 | 6.56 |
| 19.11.2024 | 3 | 10.4 | 1.08 |
| 18.11.2024 | 1.16 | 1.36 | 0.879 |
| 17.11.2024 | 0.67 | 1.03 | 0.523 |
| 16.11.2024 | 0.568 | 0.604 | 0.562 |
© Bayerisches Landesamt für Umwelt 2024