
- Start >
- Rivers >
- Discharge >
- Bayern >
- Obermühlhausen >
- Chart of year

Chart of year Obermühlhausen / Windach
Discharge from 01.01.2022 to 31.12.2022
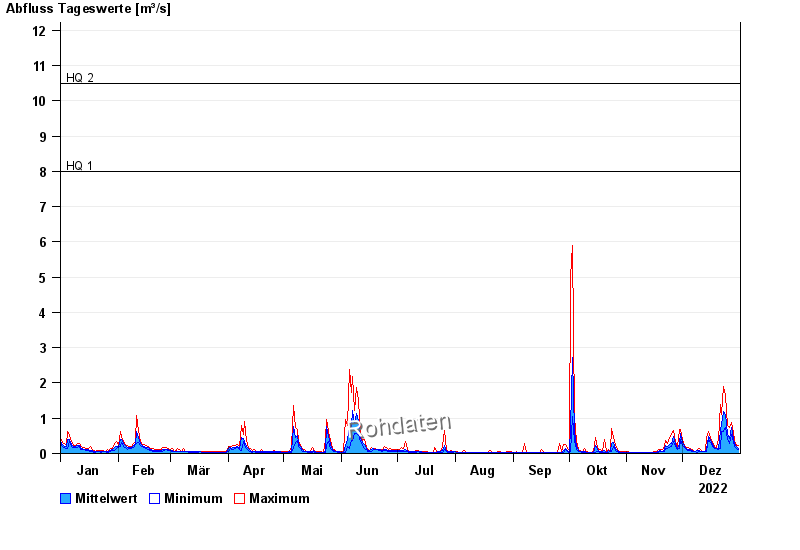
- HQ1 8 m³/s
- HQ2 10,5 m³/s
- HQ5 14 m³/s
- HQ10 17 m³/s
- HQ20 20 m³/s
- HQ50 24 m³/s
- HQ100 27 m³/s
| Date | Mean value [m³/s] | Maximum [m³/s] | Minimum [m³/s] |
|---|---|---|---|
| 31.12.2022 | 0.144 | 0.231 | 0.11 |
| 30.12.2022 | 0.18 | 0.231 | 0.136 |
| 29.12.2022 | 0.277 | 0.347 | 0.197 |
| 28.12.2022 | 0.425 | 0.577 | 0.306 |
| 27.12.2022 | 0.729 | 0.895 | 0.528 |
| 26.12.2022 | 0.415 | 0.731 | 0.267 |
| 25.12.2022 | 0.559 | 0.785 | 0.39 |
© Bayerisches Landesamt für Umwelt 2025