
- Start >
- Rivers >
- Discharge >
- Bayern >
- Obermühlhausen >
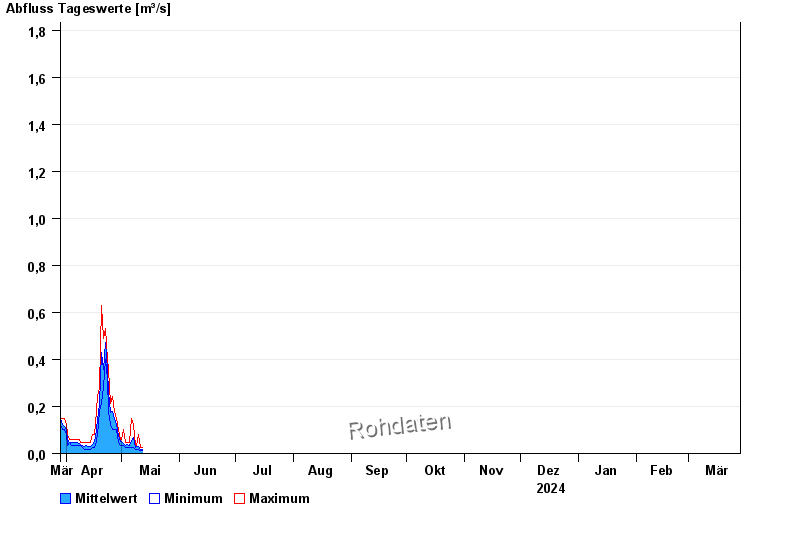
- Chart of year

Chart of year Obermühlhausen / Windach
Discharge from 29.03.2024 to 28.03.2025
- HQ1 8 m³/s
- HQ2 10,5 m³/s
- HQ5 14 m³/s
- HQ10 17 m³/s
- HQ20 20 m³/s
- HQ50 24 m³/s
- HQ100 27 m³/s
| Date | Mean value [m³/s] | Maximum [m³/s] | Minimum [m³/s] |
|---|---|---|---|
| 13.07.2024 | 6.54 | 6.71 | 6.14 |
| 12.07.2024 | 1.25 | 5.72 | 0.688 |
| 11.07.2024 | 0.617 | 0.919 | 0.478 |
| 10.07.2024 | 0.183 | 0.782 | 0.016 |
| 09.07.2024 | 0.035 | 0.045 | 0.024 |
| 08.07.2024 | 0.043 | 0.06 | 0.033 |
| 07.07.2024 | 0.039 | 0.06 | 0.024 |
© Bayerisches Landesamt für Umwelt 2024