
- Start >
- Rivers >
- Discharge >
- Bayern >
- Obermühlhausen >
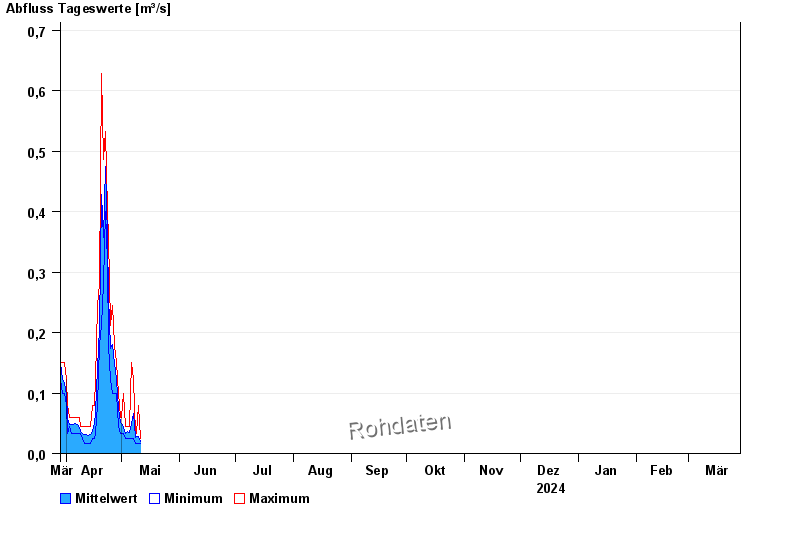
- Chart of year

Chart of year Obermühlhausen / Windach
Discharge from 29.03.2024 to 28.03.2025
- 21.05.1999 Abfluss: 25,6 m³/s
- 06.08.2000 Abfluss: 21,3 m³/s
- 02.06.2013 Abfluss: 18,8 m³/s
- 18.06.1979 Abfluss: 18,7 m³/s
- 13.04.1994 Abfluss: 16,3 m³/s
| Date | Mean value [m³/s] | Maximum [m³/s] | Minimum [m³/s] |
|---|---|---|---|
| 10.08.2024 | 0.044 | 0.053 | 0.039 |
| 09.08.2024 | 0.052 | 0.072 | 0.039 |
| 08.08.2024 | 0.052 | 0.072 | 0.039 |
| 07.08.2024 | 0.053 | 0.072 | 0.039 |
| 06.08.2024 | 0.06 | 0.072 | 0.039 |
| 05.08.2024 | 0.073 | 0.096 | 0.039 |
| 04.08.2024 | 0.097 | 0.122 | 0.072 |
© Bayerisches Landesamt für Umwelt 2024