

Chart of year Obersdorf / Rosenbach
Discharge from 01.01.2021 to 31.12.2021
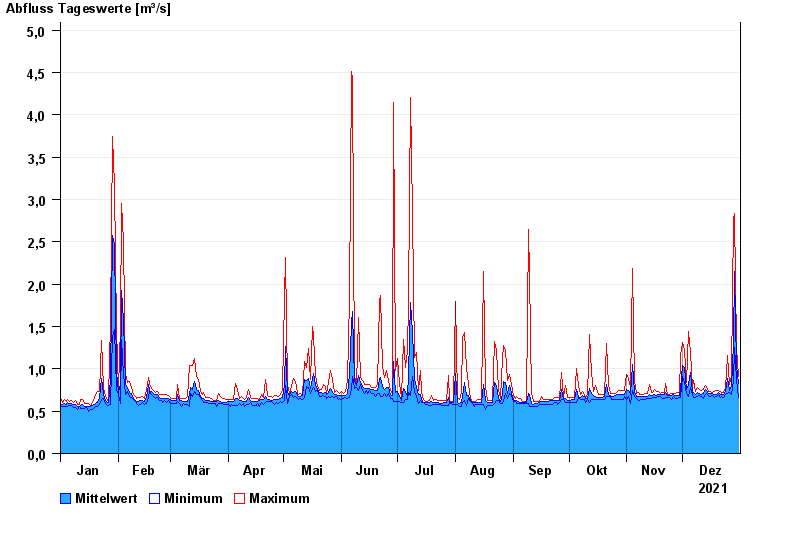
| Date | Mean value [m³/s] | Maximum [m³/s] | Minimum [m³/s] |
|---|---|---|---|
| 31.12.2021 | 0.827 | 0.912 | 0.665 |
| 30.12.2021 | 1.04 | 1.25 | 0.872 |
| 29.12.2021 | 2.15 | 2.83 | 1.25 |
| 28.12.2021 | 1.3 | 2.76 | 0.865 |
| 27.12.2021 | 0.789 | 0.919 | 0.694 |
| 26.12.2021 | 0.743 | 0.814 | 0.717 |
| 25.12.2021 | 0.88 | 1.16 | 0.705 |
© Bayerisches Landesamt für Umwelt 2025