
- Start >
- Rivers >
- Discharge >
- Bayern >
- Oberthulba >
- Chart of year

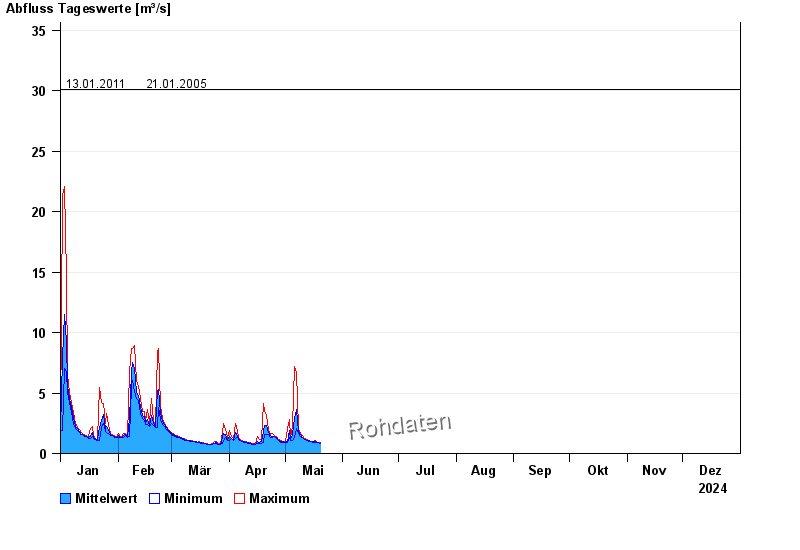
Chart of year Oberthulba / Thulba
Discharge from 01.01.2024 to 31.12.2024
- 07.02.1984 Abfluss: 45,6 m³/s
- 23.01.1995 Abfluss: 43,5 m³/s
- 03.01.2003 Abfluss: 42,1 m³/s
- 13.01.2011 Abfluss: 30,1 m³/s
- 21.01.2005 Abfluss: 30,1 m³/s
| Date | Mean value [m³/s] | Maximum [m³/s] | Minimum [m³/s] |
|---|---|---|---|
| 25.12.2024 | 1.21 | 1.31 | 1.11 |
| 24.12.2024 | 1.52 | 1.79 | 1.31 |
| 23.12.2024 | 1.77 | 2.34 | 1.59 |
| 22.12.2024 | 2.84 | 4.01 | 1.47 |
| 21.12.2024 | 1.08 | 1.41 | 0.971 |
| 20.12.2024 | 1.47 | 2.34 | 1.11 |
| 19.12.2024 | 1.14 | 2.44 | 0.655 |
© Bayerisches Landesamt für Umwelt 2024