
- Start >
- Rivers >
- Discharge >
- Bayern >
- Odelzhausen >
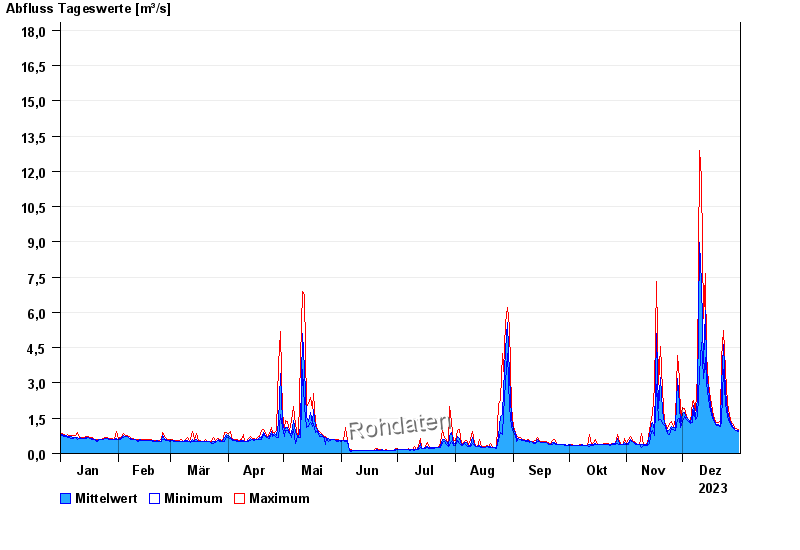
- Chart of year

Chart of year Odelzhausen / Glonn
Discharge from 01.01.2023 to 31.12.2023
- 01.06.2024 Abfluss: 91 m³/s
- 03.06.2013 Abfluss: 52 m³/s
- 04.01.2015 Abfluss: 26,4 m³/s
- 03.02.2020 Abfluss: 15,8 m³/s
- 07.12.2010 Abfluss: 15,2 m³/s
| Date | Mean value [m³/s] | Maximum [m³/s] | Minimum [m³/s] |
|---|---|---|---|
| 31.12.2023 | 1.05 | 1.12 | 1.03 |
| 30.12.2023 | 1.09 | 1.16 | 1.04 |
| 29.12.2023 | 1.13 | 1.18 | 1.09 |
| 28.12.2023 | 1.2 | 1.29 | 1.12 |
| 27.12.2023 | 1.31 | 1.4 | 1.24 |
| 26.12.2023 | 1.51 | 1.67 | 1.4 |
| 25.12.2023 | 1.89 | 2.19 | 1.63 |
© Bayerisches Landesamt für Umwelt 2025