
- Start >
- Rivers >
- Discharge >
- Bayern >
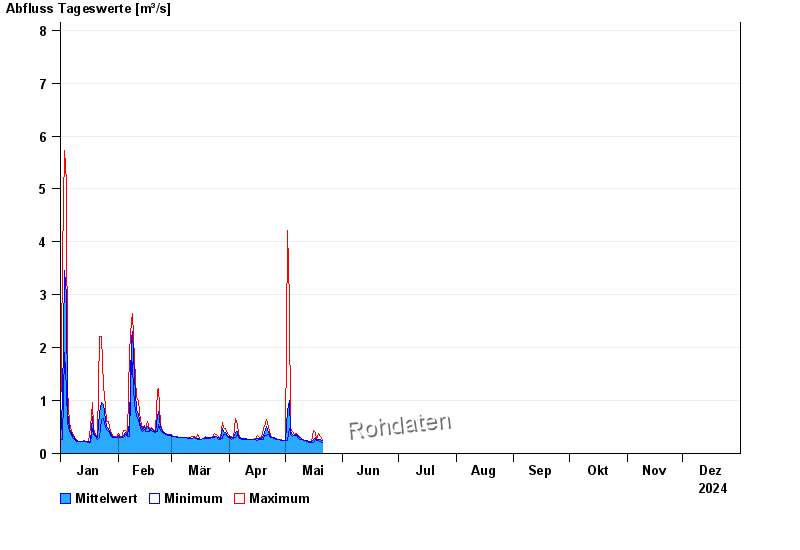
- Pfarrweisach >
- Chart of year

Chart of year Pfarrweisach / Weisach
Discharge from 01.01.2024 to 31.12.2024
- 23.01.1995 Abfluss: 28,8 m³/s
- 08.12.1981 Abfluss: 17,6 m³/s
- 12.04.2008 Abfluss: 16,8 m³/s
- 05.01.1982 Abfluss: 16,5 m³/s
- 01.04.1988 Abfluss: 15,8 m³/s
| Date | Mean value [m³/s] | Maximum [m³/s] | Minimum [m³/s] |
|---|---|---|---|
| 31.12.2024 | 0.2 | 0.2 | 0.2 |
| 30.12.2024 | 0.2 | 0.2 | 0.2 |
| 29.12.2024 | 0.2 | 0.2 | 0.2 |
| 28.12.2024 | 0.206 | 0.214 | 0.2 |
| 27.12.2024 | 0.219 | 0.228 | 0.214 |
| 26.12.2024 | 0.232 | 0.258 | 0.228 |
| 25.12.2024 | 0.257 | 0.273 | 0.243 |
© Bayerisches Landesamt für Umwelt 2025