

Chart of year Pfelling / Donau
Discharge from 01.01.2024 to 31.12.2024
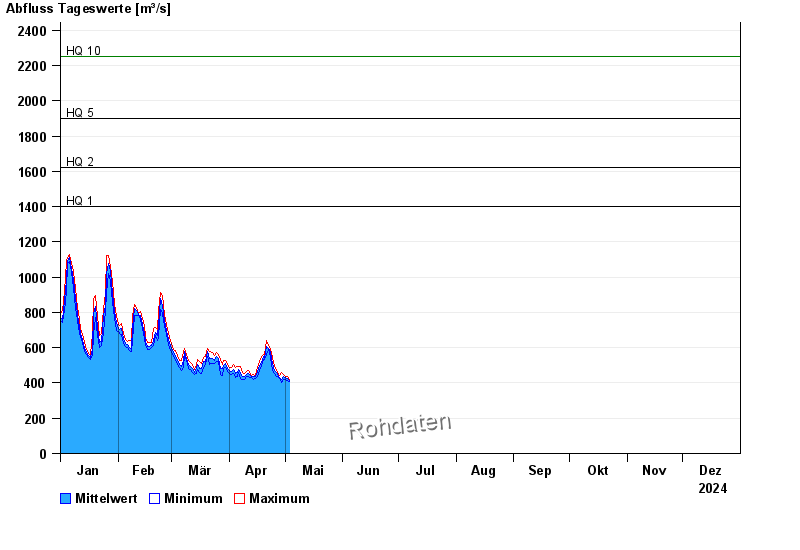
- HQ1 1400 m³/s
- HQ2 1620 m³/s
- HQ5 1900 m³/s
- HQ10 2250 m³/s
- HQ20 2600 m³/s
- HQ50 3050 m³/s
- HQ100 3400 m³/s
| Date | Mean value [m³/s] | Maximum [m³/s] | Minimum [m³/s] |
|---|---|---|---|
| 31.12.2024 | 353 | 370 | 347 |
| 30.12.2024 | 375 | 387 | 364 |
| 29.12.2024 | 389 | 406 | 375 |
| 28.12.2024 | 404 | 426 | 392 |
| 27.12.2024 | 429 | 448 | 411 |
| 26.12.2024 | 466 | 497 | 441 |
| 25.12.2024 | 520 | 548 | 500 |
© Bayerisches Landesamt für Umwelt 2025