

Chart of year Plattling / Isar
Discharge from 01.01.2021 to 31.12.2021
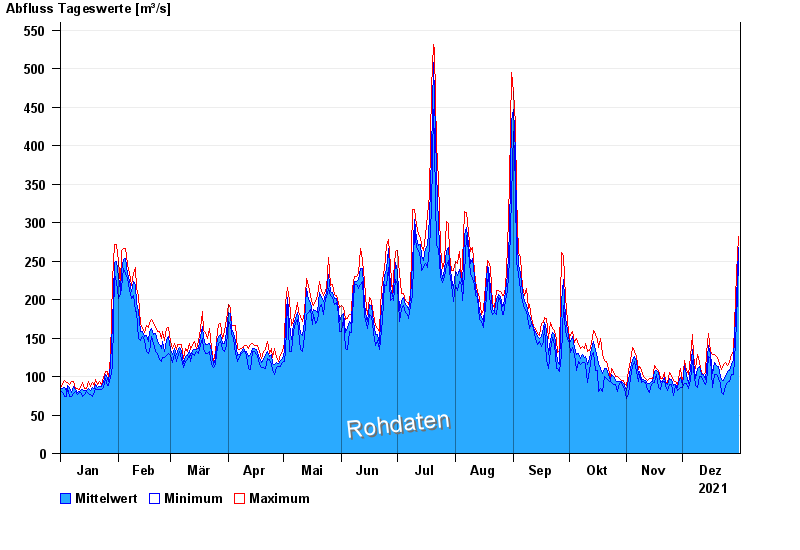
| Date | Mean value [m³/s] | Maximum [m³/s] | Minimum [m³/s] |
|---|---|---|---|
| 31.12.2021 | 269 | 285 | 253 |
| 30.12.2021 | 221 | 264 | 191 |
| 29.12.2021 | 173 | 191 | 140 |
| 28.12.2021 | 140 | 154 | 121 |
| 27.12.2021 | 134 | 148 | 121 |
| 26.12.2021 | 126 | 136 | 113 |
| 25.12.2021 | 125 | 133 | 111 |
© Bayerisches Landesamt für Umwelt 2025