
- Start >
- Rivers >
- Discharge >
- Bayern >
- Rappoldshofen >
- Chart of year

Chart of year Rappoldshofen / Aisch
Discharge from 01.01.2021 to 31.12.2021
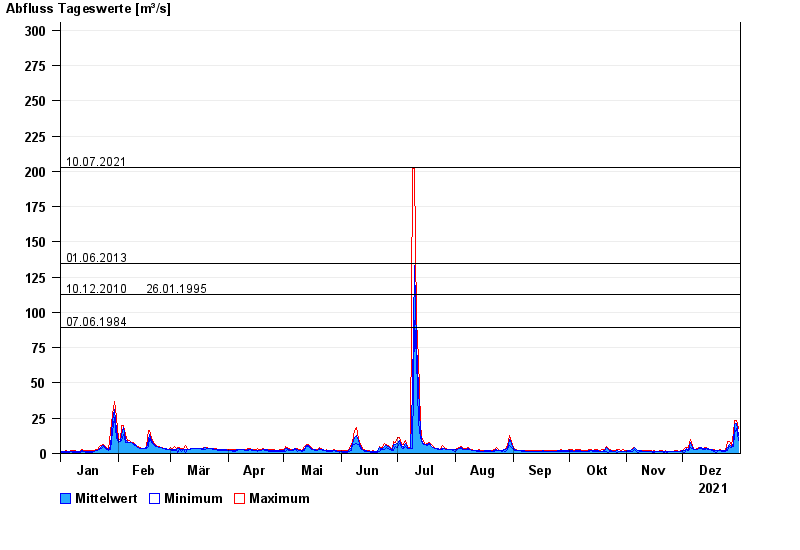
- 10.07.2021 Abfluss: 203 m³/s
- 01.06.2013 Abfluss: 135 m³/s
- 10.12.2010 Abfluss: 113 m³/s
- 26.01.1995 Abfluss: 113 m³/s
- 07.06.1984 Abfluss: 89 m³/s
| Date | Mean value [m³/s] | Maximum [m³/s] | Minimum [m³/s] |
|---|---|---|---|
| 31.12.2021 | 12.5 | 17.5 | 9.34 |
| 30.12.2021 | 21.3 | 23.3 | 17.5 |
| 29.12.2021 | 20.6 | 23.2 | 13.9 |
| 28.12.2021 | 6.85 | 13.9 | 5.22 |
| 27.12.2021 | 4.85 | 5.32 | 4.59 |
| 26.12.2021 | 6.53 | 8.33 | 4.9 |
| 25.12.2021 | 4.06 | 8.34 | 1.82 |
© Bayerisches Landesamt für Umwelt 2025