
- Start >
- Rivers >
- Discharge >
- Bayern >
- Rödenweiler >
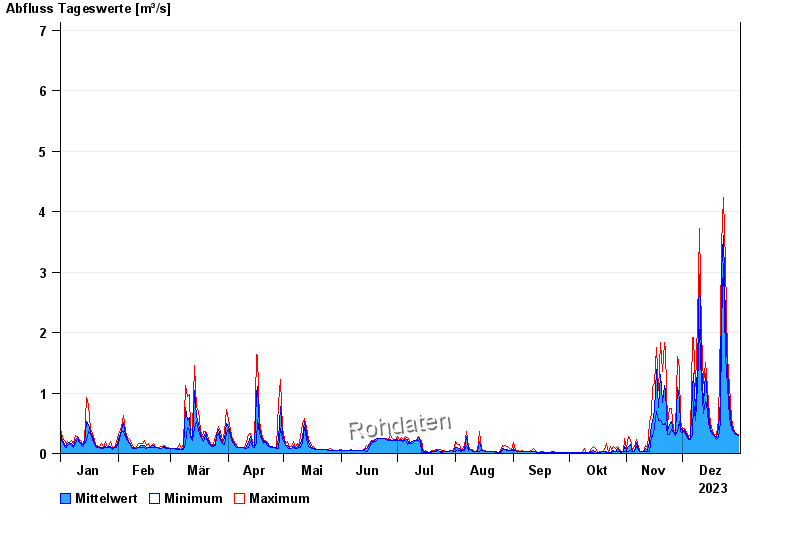
- Chart of year

Chart of year Rödenweiler / Sulzach
Discharge from 01.01.2023 to 31.12.2023
note
Wasserstand und Abfluss wird zeitweise durch Biberdamm beeinflusst.
- 21.05.1999 Abfluss: 19,1 m³/s
- 21.12.1993 Abfluss: 16,8 m³/s
- 28.10.1998 Abfluss: 13,9 m³/s
- 15.06.2007 Abfluss: 13,4 m³/s
- 26.02.1997 Abfluss: 12,5 m³/s
| Date | Mean value [m³/s] | Maximum [m³/s] | Minimum [m³/s] |
|---|---|---|---|
| 31.12.2023 | 0.3 | 0.32 | 0.292 |
| 30.12.2023 | 0.324 | 0.331 | 0.32 |
| 29.12.2023 | 0.341 | 0.361 | 0.331 |
| 28.12.2023 | 0.38 | 0.418 | 0.361 |
| 27.12.2023 | 0.481 | 0.571 | 0.418 |
| 26.12.2023 | 0.801 | 1.1 | 0.583 |
| 25.12.2023 | 1.39 | 1.61 | 1.1 |
© Bayerisches Landesamt für Umwelt 2025