
- Start >
- Rivers >
- Discharge >
- Bayern >
- Roth Bleiche >
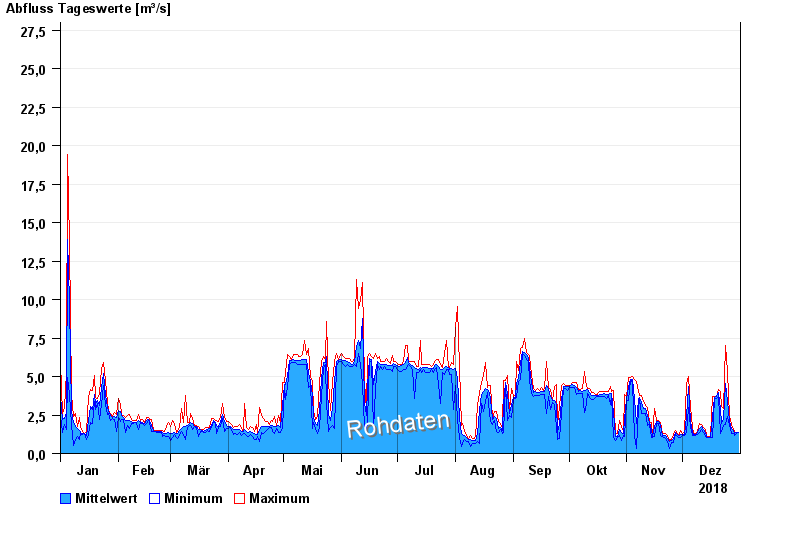
- Chart of year

Chart of year Roth Bleiche / Roth
Discharge from 01.01.2018 to 31.12.2018
- 22.02.1970 Abfluss: 56,1 m³/s
- 25.04.1980 Abfluss: 47,8 m³/s
- 03.03.1987 Abfluss: 45,2 m³/s
- 08.05.1978 Abfluss: 43,3 m³/s
- 16.10.1981 Abfluss: 36,2 m³/s
| Date | Mean value [m³/s] | Maximum [m³/s] | Minimum [m³/s] |
|---|---|---|---|
| 31.12.2018 | 1.36 | 1.37 | 1.35 |
| 30.12.2018 | 1.34 | 1.35 | 1.27 |
| 29.12.2018 | 1.33 | 1.41 | 1.2 |
| 28.12.2018 | 1.47 | 1.56 | 1.33 |
| 27.12.2018 | 1.63 | 1.91 | 1.33 |
| 26.12.2018 | 2.08 | 2.43 | 1.82 |
| 25.12.2018 | 3.41 | 5.3 | 2.43 |
© Bayerisches Landesamt für Umwelt 2025