

Chart of year Ruhstorf / Rott
Discharge from 01.01.2020 to 31.12.2020
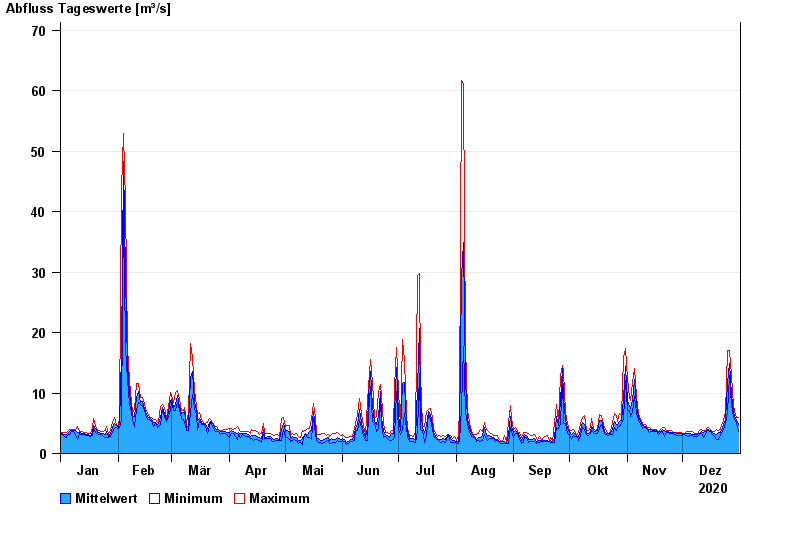
| Date | Mean value [m³/s] | Maximum [m³/s] | Minimum [m³/s] |
|---|---|---|---|
| 31.12.2020 | 4.83 | 5.88 | 3.64 |
| 30.12.2020 | 5.52 | 5.88 | 5.16 |
| 29.12.2020 | 6.07 | 6.88 | 5.63 |
| 28.12.2020 | 6.75 | 7.93 | 6.12 |
| 27.12.2020 | 9.68 | 12.9 | 7.93 |
| 26.12.2020 | 14.9 | 17.1 | 12.9 |
| 25.12.2020 | 11.8 | 17.1 | 6.86 |
© Bayerisches Landesamt für Umwelt 2024