

Chart of year Schönach / Große Laber
Discharge from 17.08.2020 to 16.08.2021
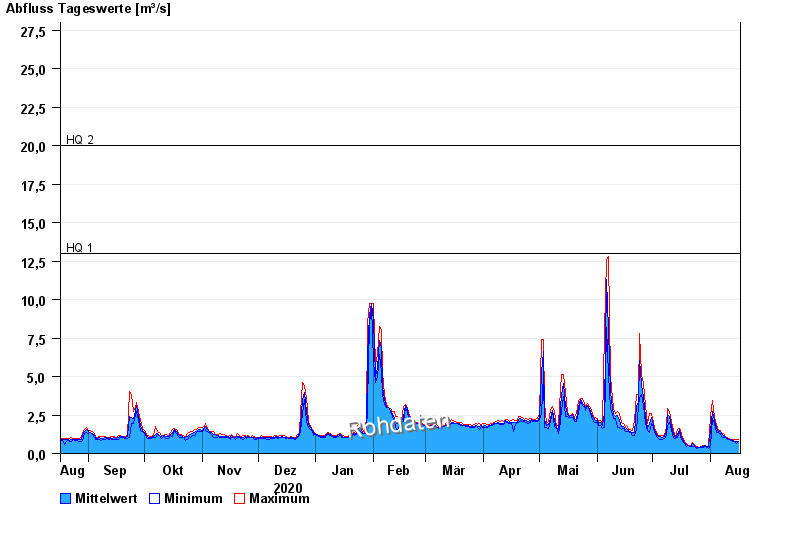
- HQ1 13 m³/s
- HQ2 20 m³/s
- HQ5 30 m³/s
- HQ10 40 m³/s
- HQ20 55 m³/s
- HQ50 75 m³/s
- HQ100 95 m³/s
| Date | Mean value [m³/s] | Maximum [m³/s] | Minimum [m³/s] |
|---|---|---|---|
| 16.08.2021 | 0.81 | 0.919 | 0.77 |
| 15.08.2021 | 0.804 | 0.879 | 0.669 |
| 14.08.2021 | 0.81 | 0.879 | 0.77 |
| 13.08.2021 | 0.845 | 0.879 | 0.805 |
| 12.08.2021 | 0.879 | 0.919 | 0.841 |
| 11.08.2021 | 0.94 | 1 | 0.879 |
| 10.08.2021 | 0.989 | 1.04 | 0.919 |
© Bayerisches Landesamt für Umwelt 2024