
- Start >
- Rivers >
- Discharge >
- Bayern >
- Schwabelweis >
- Chart of year

Chart of year Schwabelweis / Donau
Discharge from 01.01.2022 to 31.12.2022
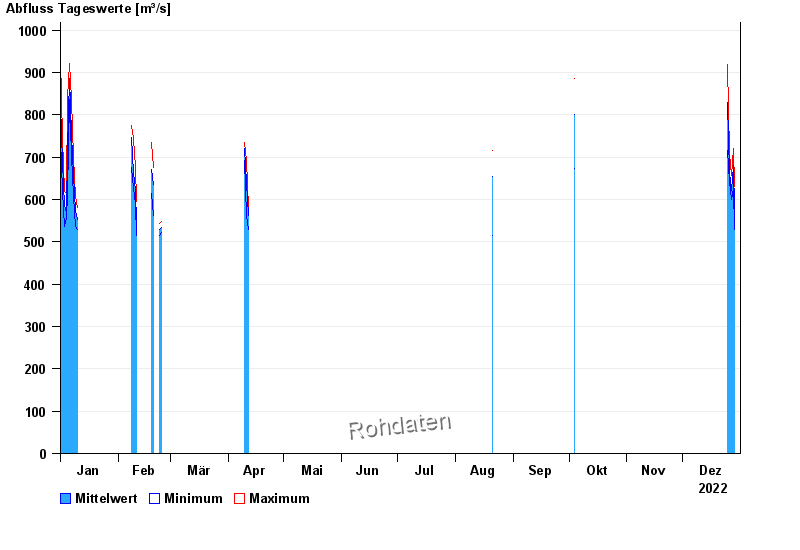
| Date | Mean value [m³/s] | Maximum [m³/s] | Minimum [m³/s] |
|---|---|---|---|
| 29.12.2022 | 571 | 631 | 529 |
| 28.12.2022 | 681 | 721 | 625 |
| 27.12.2022 | 622 | 656 | 600 |
| 26.12.2022 | 664 | 709 | 643 |
| 25.12.2022 | 830 | 920 | 715 |
| 24.12.2022 | -- | -- | -- |
| 23.12.2022 | -- | -- | -- |
© Bayerisches Landesamt für Umwelt 2025