
- Start >
- Rivers >
- Discharge >
- Bayern >
- Schweinfurt Neuer Hafen >
- Chart of year

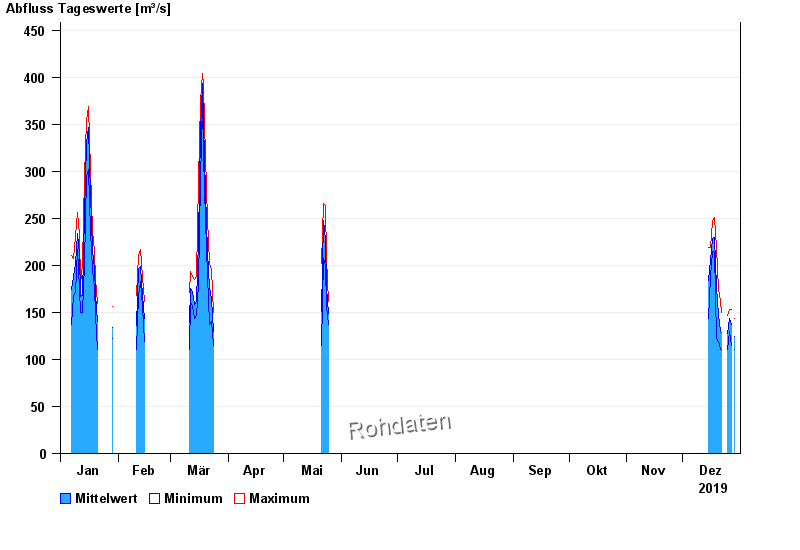
Chart of year Schweinfurt Neuer Hafen / Main
Discharge from 01.01.2019 to 31.12.2019
| Date | Mean value [m³/s] | Maximum [m³/s] | Minimum [m³/s] |
|---|---|---|---|
| 31.12.2019 | 82.2 | 93.4 | 76.1 |
| 30.12.2019 | 91.7 | 106 | 73.4 |
| 29.12.2019 | 105 | 116 | 98 |
| 28.12.2019 | 109 | 122 | 97 |
| 27.12.2019 | 126 | 139 | 116 |
| 26.12.2019 | 124 | 130 | 118 |
| 25.12.2019 | 106 | 125 | 91.5 |
© Bayerisches Landesamt für Umwelt 2025