
- Start >
- Rivers >
- Discharge >
- Bayern >
- Seemannsmühle >
- Chart of year

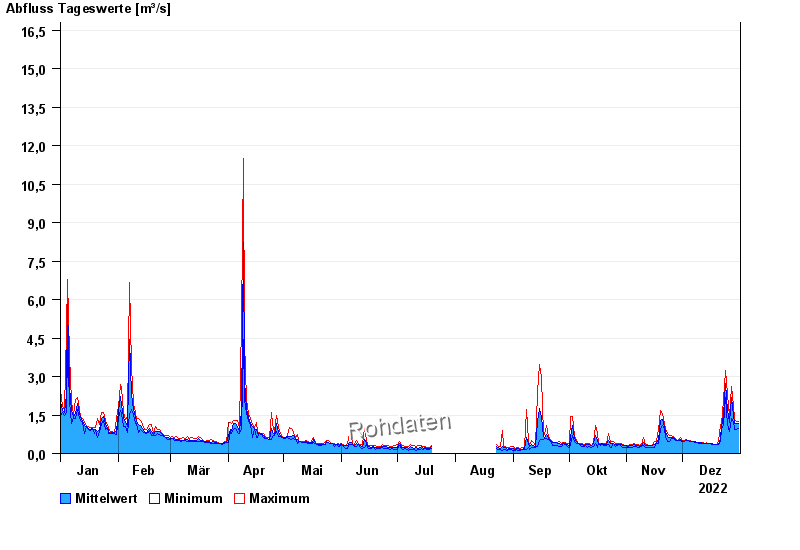
Chart of year Seemannsmühle / Schwäbische Rezat
Discharge from 01.01.2022 to 31.12.2022
- 02.03.1987 Abfluss: 39,1 m³/s
- 13.01.2011 Abfluss: 36,3 m³/s
- 08.01.2011 Abfluss: 34,4 m³/s
- 13.04.1994 Abfluss: 34,3 m³/s
- 21.12.1993 Abfluss: 30,1 m³/s
| Date | Mean value [m³/s] | Maximum [m³/s] | Minimum [m³/s] |
|---|---|---|---|
| 31.12.2022 | 1.17 | 1.26 | 0.991 |
| 30.12.2022 | 1.16 | 1.26 | 0.948 |
| 29.12.2022 | 1.16 | 1.31 | 0.948 |
| 28.12.2022 | 1.49 | 1.89 | 1.26 |
| 27.12.2022 | 2.17 | 2.62 | 1.36 |
| 26.12.2022 | 1.22 | 1.45 | 0.867 |
| 25.12.2022 | 1.67 | 2.3 | 1.12 |
© Bayerisches Landesamt für Umwelt 2025