

Chart of year Seltmans / Untere Argen
Discharge from 01.01.2024 to 31.12.2024
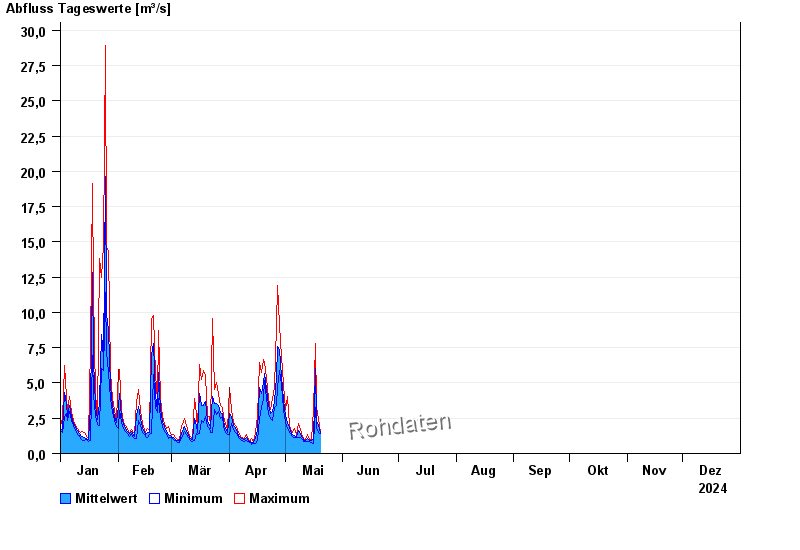
| Date | Mean value [m³/s] | Maximum [m³/s] | Minimum [m³/s] |
|---|---|---|---|
| 31.12.2024 | 1.16 | 1.39 | 1.01 |
| 30.12.2024 | 1.23 | 1.48 | 1.08 |
| 29.12.2024 | 1.31 | 1.48 | 1.15 |
| 28.12.2024 | 1.41 | 1.66 | 1.15 |
| 27.12.2024 | 1.55 | 1.66 | 1.39 |
| 26.12.2024 | 1.78 | 1.98 | 1.57 |
| 25.12.2024 | 2.13 | 2.43 | 1.76 |
© Bayerisches Landesamt für Umwelt 2025