
- Start >
- Rivers >
- Discharge >
- Bayern >
- Tiefenbach >
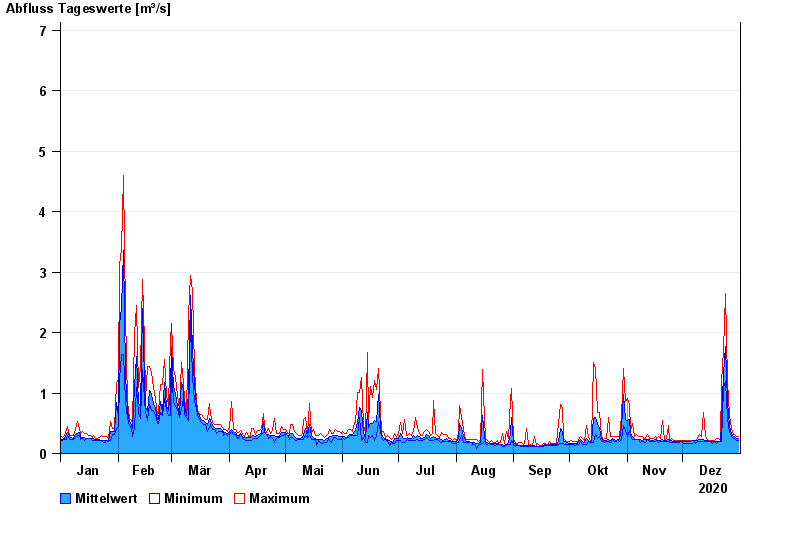
- Chart of year

Chart of year Tiefenbach / Bayerische Schwarzach
Discharge from 01.01.2020 to 31.12.2020
- 05.12.1988 Abfluss: 29,5 m³/s
- 26.01.1995 Abfluss: 26 m³/s
- 21.12.1993 Abfluss: 23,5 m³/s
- 26.02.1997 Abfluss: 19,7 m³/s
- 30.12.1986 Abfluss: 19,2 m³/s
| Date | Mean value [m³/s] | Maximum [m³/s] | Minimum [m³/s] |
|---|---|---|---|
| 31.12.2020 | 0.242 | 0.279 | 0.22 |
| 30.12.2020 | 0.248 | 0.279 | 0.221 |
| 29.12.2020 | 0.273 | 0.311 | 0.248 |
| 28.12.2020 | 0.284 | 0.311 | 0.249 |
| 27.12.2020 | 0.328 | 0.419 | 0.279 |
| 26.12.2020 | 0.454 | 0.626 | 0.345 |
| 25.12.2020 | 0.858 | 1.19 | 0.583 |
© Bayerisches Landesamt für Umwelt 2025