
- Start >
- Rivers >
- Discharge >
- Bayern >
- Tiefenbach >
- Chart of year

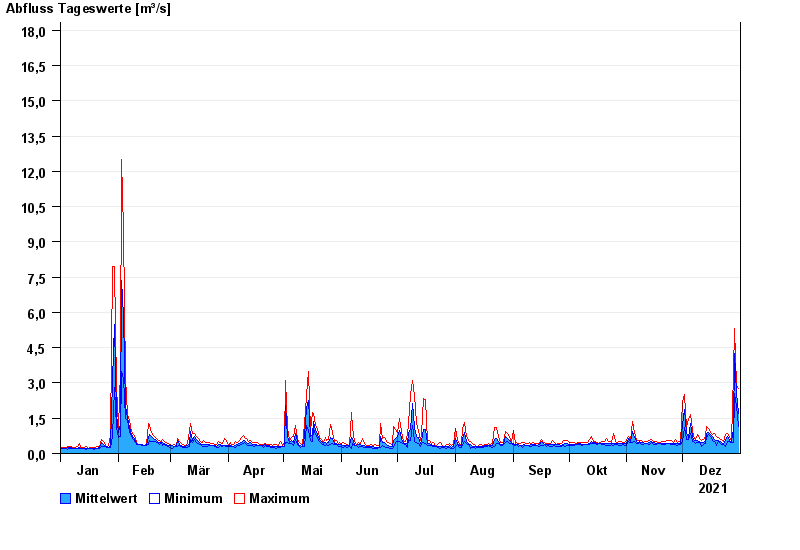
Chart of year Tiefenbach / Bayerische Schwarzach
Discharge from 01.01.2021 to 31.12.2021
- 05.12.1988 Abfluss: 29,5 m³/s
- 26.01.1995 Abfluss: 26 m³/s
- 21.12.1993 Abfluss: 23,5 m³/s
- 26.02.1997 Abfluss: 19,7 m³/s
- 30.12.1986 Abfluss: 19,2 m³/s
| Date | Mean value [m³/s] | Maximum [m³/s] | Minimum [m³/s] |
|---|---|---|---|
| 31.12.2021 | 1.71 | 2.75 | 1.16 |
| 30.12.2021 | 2.54 | 2.88 | 2 |
| 29.12.2021 | 4.26 | 5.32 | 2.57 |
| 28.12.2021 | 1.02 | 3.46 | 0.471 |
| 27.12.2021 | 0.507 | 0.517 | 0.471 |
| 26.12.2021 | 0.57 | 0.702 | 0.517 |
| 25.12.2021 | 0.706 | 0.844 | 0.518 |
© Bayerisches Landesamt für Umwelt 2025