

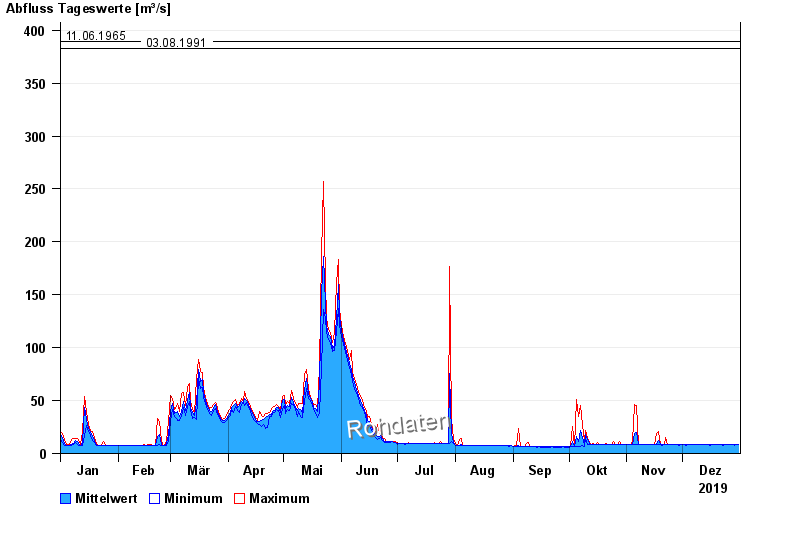
Chart of year Trostberg / Alz
Discharge from 01.01.2019 to 31.12.2019
- 02.06.2013 Abfluss: 566 m³/s
- 12.08.2002 Abfluss: 528 m³/s
- 09.07.1954 Abfluss: 458 m³/s
- 11.06.1965 Abfluss: 389 m³/s
- 03.08.1991 Abfluss: 383 m³/s
| Date | Mean value [m³/s] | Maximum [m³/s] | Minimum [m³/s] |
|---|---|---|---|
| 31.12.2019 | 8.32 | 8.49 | 8.12 |
| 30.12.2019 | 8.33 | 8.87 | 8.12 |
| 29.12.2019 | 8.14 | 8.49 | 7.75 |
| 28.12.2019 | 8.15 | 8.49 | 8.12 |
| 27.12.2019 | 8.16 | 8.49 | 8.12 |
| 26.12.2019 | 8.12 | 8.12 | 8.12 |
| 25.12.2019 | 8.15 | 8.49 | 8.12 |
© Bayerisches Landesamt für Umwelt 2024