

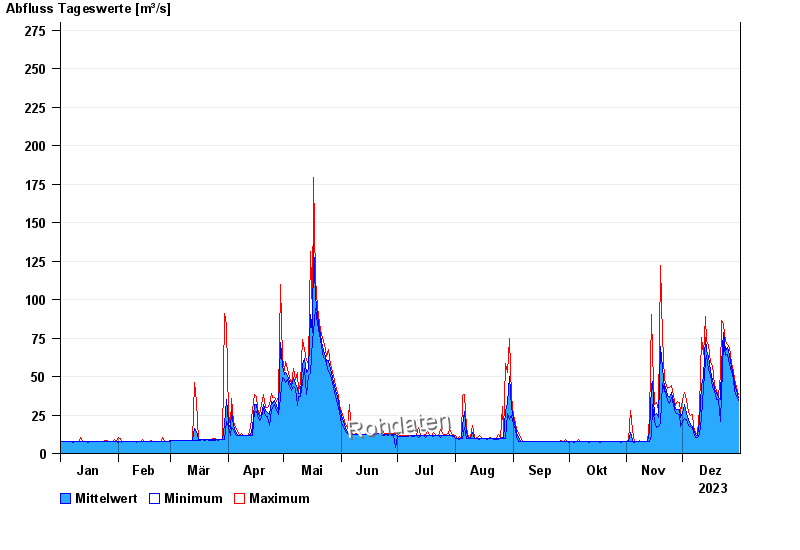
Chart of year Trostberg / Alz
Discharge from 01.01.2023 to 31.12.2023
- 02.06.2013 Abfluss: 566 m³/s
- 12.08.2002 Abfluss: 528 m³/s
- 09.07.1954 Abfluss: 458 m³/s
- 11.06.1965 Abfluss: 389 m³/s
- 03.08.1991 Abfluss: 383 m³/s
| Date | Mean value [m³/s] | Maximum [m³/s] | Minimum [m³/s] |
|---|---|---|---|
| 31.12.2023 | 36.2 | 38.6 | 34.2 |
| 30.12.2023 | 40.7 | 43.2 | 37.2 |
| 29.12.2023 | 45.4 | 48 | 40.9 |
| 28.12.2023 | 50.4 | 53 | 48 |
| 27.12.2023 | 56.2 | 59 | 53 |
| 26.12.2023 | 63.4 | 69 | 58.1 |
| 25.12.2023 | 68.7 | 70.8 | 64.4 |
© Bayerisches Landesamt für Umwelt 2024