
- Start >
- Rivers >
- Discharge >
- Bayern >
- Trunstadt Q >
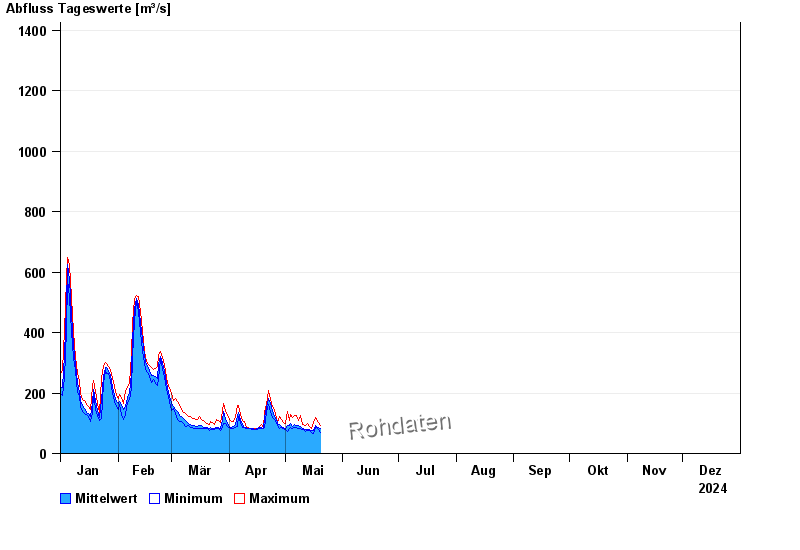
- Chart of year

Chart of year Trunstadt Q / Main
Discharge from 01.01.2024 to 31.12.2024
 Für diesen Pegel sind keine Jährlichkeiten hinterlegt.
note
STÖRUNG BEHOBEN - Ultraschallanlage; kein Hochwasserpegel
| Date | Mean value [m³/s] | Maximum [m³/s] | Minimum [m³/s] |
|---|---|---|---|
| 31.12.2024 | 85 | 105 | 77.1 |
| 30.12.2024 | 89.1 | 118 | 84.8 |
| 29.12.2024 | 93.1 | 120 | 86.9 |
| 28.12.2024 | 110 | 142 | 91.1 |
| 27.12.2024 | 118 | 144 | 102 |
| 26.12.2024 | 142 | 168 | 131 |
| 25.12.2024 | 168 | 182 | 137 |
© Bayerisches Landesamt für Umwelt 2025