

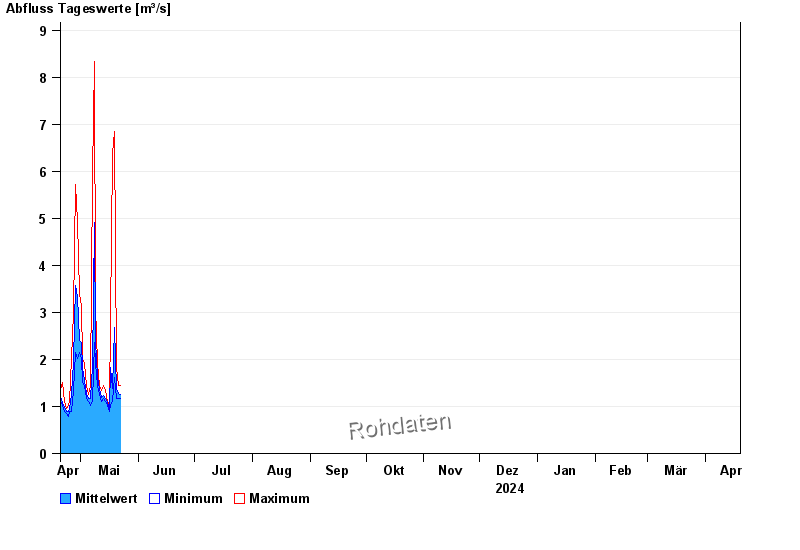
Chart of year Unternogg / Halbammer
Discharge from 20.04.2024 to 19.04.2025
note
Wasserstandsaufzeichnung möglicherweise durch Vereisung verfälscht.
| Date | Mean value [m³/s] | Maximum [m³/s] | Minimum [m³/s] |
|---|---|---|---|
| 24.01.2025 | 0.424 | 0.49 | 0.379 |
| 23.01.2025 | 0.438 | 0.53 | 0.345 |
| 22.01.2025 | 0.359 | 0.379 | 0.345 |
| 21.01.2025 | 0.37 | 0.379 | 0.345 |
| 20.01.2025 | 0.379 | 0.415 | 0.345 |
| 19.01.2025 | 0.378 | 0.452 | 0.345 |
| 18.01.2025 | 0.372 | 0.452 | 0.313 |
© Bayerisches Landesamt für Umwelt 2025