
- Start >
- Rivers >
- Discharge >
- Bayern >
- Unterthingau >
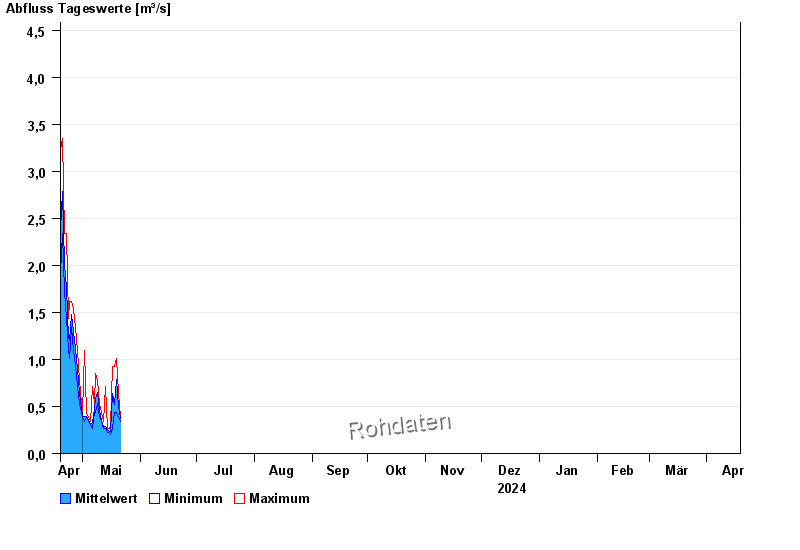
- Chart of year

Chart of year Unterthingau / Kirnach
Discharge from 19.04.2024 to 18.04.2025
- 21.05.1999 Abfluss: 49,5 m³/s
- 01.06.2013 Abfluss: 43,7 m³/s
- 30.06.2011 Abfluss: 38,2 m³/s
- 21.09.2000 Abfluss: 38 m³/s
- 12.08.2002 Abfluss: 37,4 m³/s
| Date | Mean value [m³/s] | Maximum [m³/s] | Minimum [m³/s] |
|---|---|---|---|
| 13.01.2025 | 0.229 | 0.325 | 0.163 |
| 12.01.2025 | 0.369 | 0.562 | 0.196 |
| 11.01.2025 | 0.692 | 0.942 | 0.437 |
| 10.01.2025 | 1.59 | 2.31 | 1.03 |
| 09.01.2025 | 1.63 | 2.11 | 1.31 |
| 08.01.2025 | 1.51 | 2 | 1.21 |
| 07.01.2025 | 2.02 | 2.53 | 1.39 |
© Bayerisches Landesamt für Umwelt 2025