
- Start >
- Rivers >
- Discharge >
- Bayern >
- Viechtach Reibenmühle >
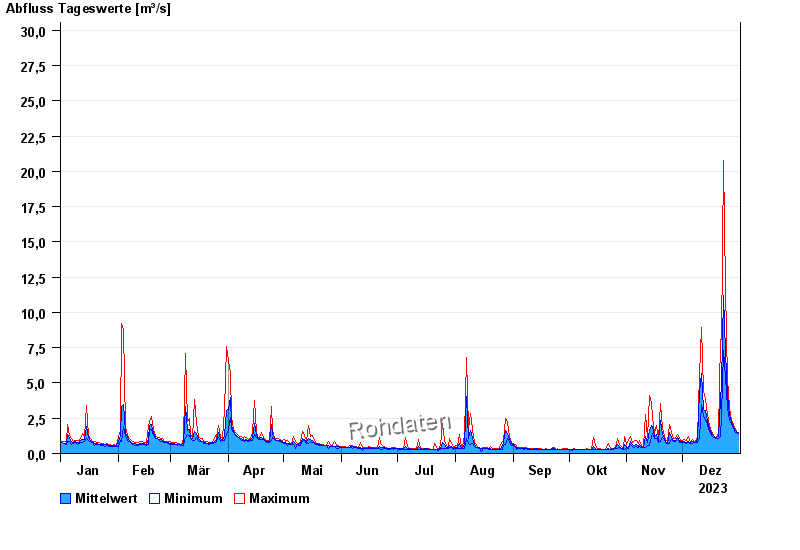
- Chart of year

Chart of year Viechtach Reibenmühle / Aitnach
Discharge from 01.01.2023 to 31.12.2023
- 25.06.2016 Abfluss: 50,8 m³/s
- 06.01.1982 Abfluss: 46,3 m³/s
- 01.11.1998 Abfluss: 42,3 m³/s
- 17.08.2001 Abfluss: 39,3 m³/s
- 03.12.2007 Abfluss: 36,5 m³/s
| Date | Mean value [m³/s] | Maximum [m³/s] | Minimum [m³/s] |
|---|---|---|---|
| 31.12.2023 | 1.76 | 1.91 | 1.7 |
| 30.12.2023 | 1.89 | 1.98 | 1.8 |
| 29.12.2023 | 2.09 | 2.2 | 1.97 |
| 28.12.2023 | 2.29 | 2.41 | 2.2 |
| 27.12.2023 | 2.62 | 2.87 | 2.41 |
| 26.12.2023 | 3.23 | 3.73 | 2.78 |
| 25.12.2023 | 4.63 | 5.9 | 3.7 |
© Bayerisches Landesamt für Umwelt 2025