

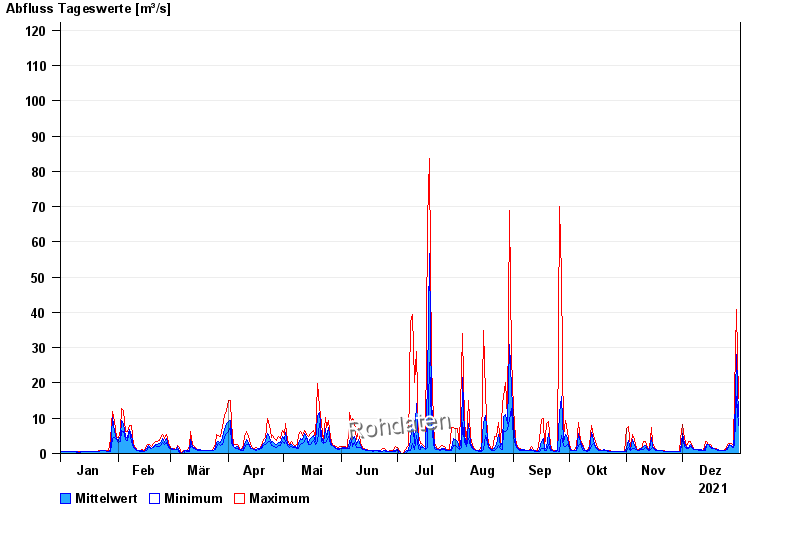
Chart of year Walchen / Walchen
Discharge from 01.01.2021 to 31.12.2021
- 06.08.1985 Abfluss: 316 m³/s
- 31.07.1977 Abfluss: 303 m³/s
- 12.12.1961 Abfluss: 295 m³/s
- 20.07.1981 Abfluss: 252 m³/s
- 11.06.1965 Abfluss: 237 m³/s
| Date | Mean value [m³/s] | Maximum [m³/s] | Minimum [m³/s] |
|---|---|---|---|
| 31.12.2021 | 10.5 | 15.7 | 7.82 |
| 30.12.2021 | 28 | 40.9 | 16.1 |
| 29.12.2021 | 5.68 | 16.9 | 2.43 |
| 28.12.2021 | 1.86 | 2.43 | 1.74 |
| 27.12.2021 | 2.31 | 2.76 | 1.99 |
| 26.12.2021 | 2.58 | 2.76 | 2.43 |
| 25.12.2021 | 1.71 | 2.43 | 1.15 |
© Bayerisches Landesamt für Umwelt 2025