
- Start >
- Rivers >
- Discharge >
- Bayern >
- Windischeschenbach >
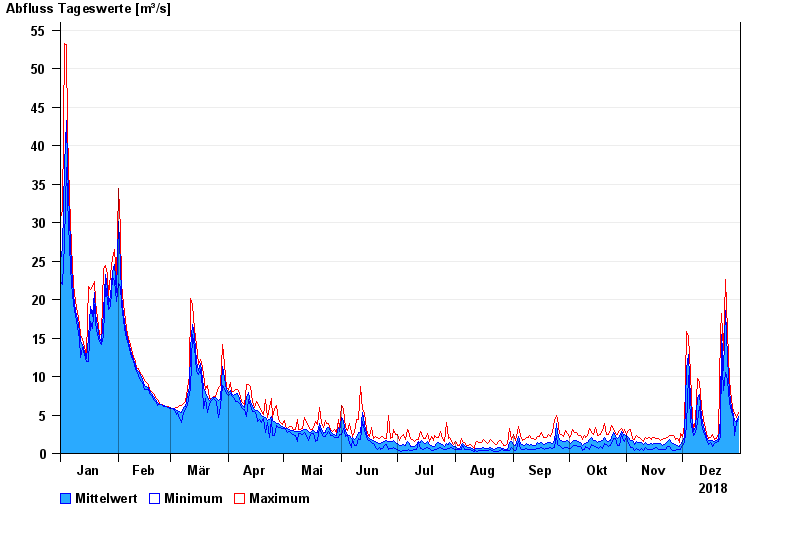
- Chart of year

Chart of year Windischeschenbach / Waldnaab
Discharge from 01.01.2018 to 31.12.2018
| Date | Mean value [m³/s] | Maximum [m³/s] | Minimum [m³/s] |
|---|---|---|---|
| 31.12.2018 | 4.84 | 5.27 | 4.38 |
| 30.12.2018 | 4.21 | 4.62 | 4.01 |
| 29.12.2018 | 4.27 | 5.15 | 2.31 |
| 28.12.2018 | 4.98 | 5.48 | 4.72 |
| 27.12.2018 | 6.01 | 6.83 | 5.48 |
| 26.12.2018 | 7.98 | 9.43 | 6.57 |
| 25.12.2018 | 12.3 | 15.9 | 9.43 |
© Bayerisches Landesamt für Umwelt 2025